Data-driven Decision-making Processes
Data visualization and Reporting Softwares make data-driven decision-making processes accessible to SMEs.
Published by Luigi Bidoia. .
Planning Internationalisation SME Data visualization Digital Export
Log in to use the pretty print function and embed function.
Aren't you signed up yet?
signup!
The internationalization process involves choices with high opportunities but also high risks for a company. Selling on a new market allows companies to implement strategies of product differentiation and intercept a wide demand for high quality products, in exchange for a premium price.
At the same time, however, entering a new market might require skills not always present in the company. Moreover, competitors might have competitive advantages that cannot be replicated.
The higher degree of uncertainty should presuppose a business organisation able to react promptly to unforeseen situations. A key tool to achieve this goal is to use a transparent and shared decision-making process. Only transparent decisions obtained with the participation of all business units can be quickly reshaped in case of unforeseen facts, ensuring a compact and consistent corporate response.
Participation and transparency are certainly necessary, but not sufficient. Of equal importance is the information set on which decisions are based, which must be numerical and as objective as possible, in order to represent a basis for comparison among the different actors involved.
However, the people involved in the decision-making process are not always equally capable of translating the data into the necessary information. In this case it is essential to transform data into information through the use of appropriate IT tools. In recent years, there has been a strong development of two useful IT tools for this purpose: Data Visualization (or Dataviz) and Reporting Software. Company's area that makes the most use of these tools is Business Intelligence, understood as the set of activities that turn data, both internal and external, into business information to support the decision-making process.
Data Visualization
In very simple terms, Data Visualization techniques consist in transforming data into graphic images that facilitate the reading of the phenomena contained. Moreover, inserting the image in a context, the Data Visualization allows to transform the data in a useful information for decisional processes.
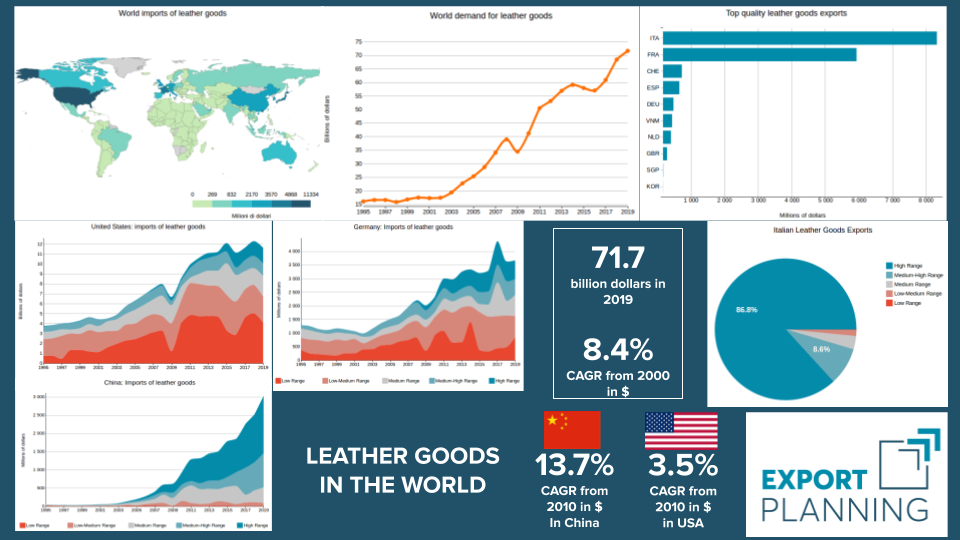
Let us consider the case of an Italian SME with a winning marketing mix on the German market, exporting medium-quality leather goods. Let us suppose that the company wants to enter a new foreign market and that two opposing sides are formed: the first one believes that the greatest potential is given by the large and developed American market (with over 10 billion dollars of sectorial imports); the second one, on the other hand, is leaning towards the Chinese market, which is in a phase of strong growth (from values below one billion dollars at the beginning of the decade to almost 3 billion dollars last year).
A simple comparison between imports of leather goods from the United States and China, divided by quality/price range, can offer the company an initial assessment of which market to focus on next.
Source: ExportPlanning, Analytics section.
The graphs clearly show the strong difference in the composition by quality/price range of US and Chinese leather goods imports. China imports more than 80% of quality products; for the United States this share is reduced to less than 20%. Thus, entering the Chinese market might be difficult without a high-quality product. On the contrary, the American market (more similar in terms of quality of imports to the German one) could be easier to access.
This information might lead to a comparison on the long-term sustainability of company's mid-range positioning. Moreover, the information that the average quality of Italian leather goods exports has risen sharply in recent years and that in 2019 high-end exports account for 90% of the total, might lead the company to consider a qualitative upgrading. In this case, the Chinese market would certainly present the greatest opportunities, given the strong growth of high-end Chinese imports.
In the example presented here, a few numbers and their graphical representation allow the company to overcome the choice between the American market and the Chinese one, facing an alternative of greater strategic value:
- Maintain its competitive positioning in medium quality range and, in this case, develop an export project focused on the United States
- Implement a process of qualitative upgrading and define China as the target market
It is evident from this example that only the use of objective data and their transformation into information can allow a transparent and shared decision.
Reporting Software
Reporting Softwares tools allow to extend the benefits of Data Visualization, through the combination of several visual and qualitative elements that allow to produce a wider information set than the one that can be expressed through a single graphic element.
Basically, this is what we could have done in the previous example if, in addition to showing the graphs of imports by quality range from the United States and China, we had also presented imports from Germany and Italian exports to show the strong shift towards the higher price range that has taken place in the last decade.
An example is shown by the following chart.