Business Cycles in World Mechanical Industry
Cyclical indicators can be derived from world trade in goods used in the different stages of the value chain.
Published by Luigi Bidoia. .
Industrial equipment Foreign markets Internationalisation tools
At the beginning of 2019, we analysed the business cycle of global mechanical industry over the past 20 years (see the articles: The investment cycles of the mechanical industry in the world and The world market of mechanical industry machines), using the demand for mechanical industry machinery as a proxy for the cycle.
In this article we will measure the business cycle of world mechanical industry (excluding means of transport) using world trade data1 of the following aggregates:
- Final products: equipment, machinery and plants
- Mechanical components
- Semi-finished steel products: forged and printed, unprocessed or partially worked
- Machines (tools and not) for working metals
These different groups of goods represent different stages of the value chain in world mechanical industry; the analysis of their trade dynamics allows to verify if the sectors that make up this value chain follow the same economic cycle.
The following graph shows the dynamics of the four indicators.
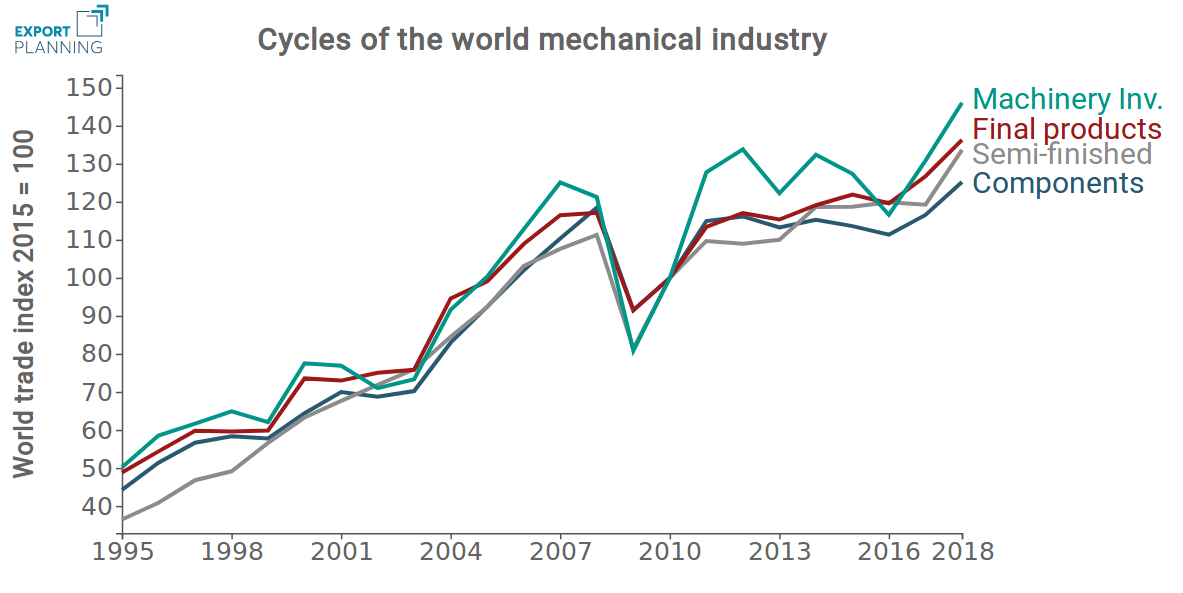
The graph clearly demonstrates that the four indicators show the very same dynamics: this leads to consider foreign trade indices as reliable measures of the business cycle in world mechanical industry.
Business cycle indices can be particularly useful for all those companies taking part in the mechanical industry value chain: in this context, it cannot be easy to evaluate whether one's performance can be attributed to external factors - related to business cycle - or to internal factors, such as a change in competitiveness. The correct evaluation of the contribution of each factor can lead to a better choice in terms of internationalisation, confirming or not the specific actions addressed to the different foreign markets.
As regards economic cycle, the graph clearly indicates the presence of a phase of strong development for the world mechanical industry in the final part of the last century and, above all, in the early years of the current century. The 2008 crisis hit the mechanical industry and brought a long period of stagnation, that lasted until 2016. Growth resumed at the end of 2016, and then paused again in the second part of 2018, due to the growing climate of uncertainty affecting the world economy.
Updating of these indicators for H1-2019 we could have a clue about the intensity of the current phase of slowdown (or even fall) of the global mechanical industry.
Mechanical industry: which countries are affected by the slowdown?
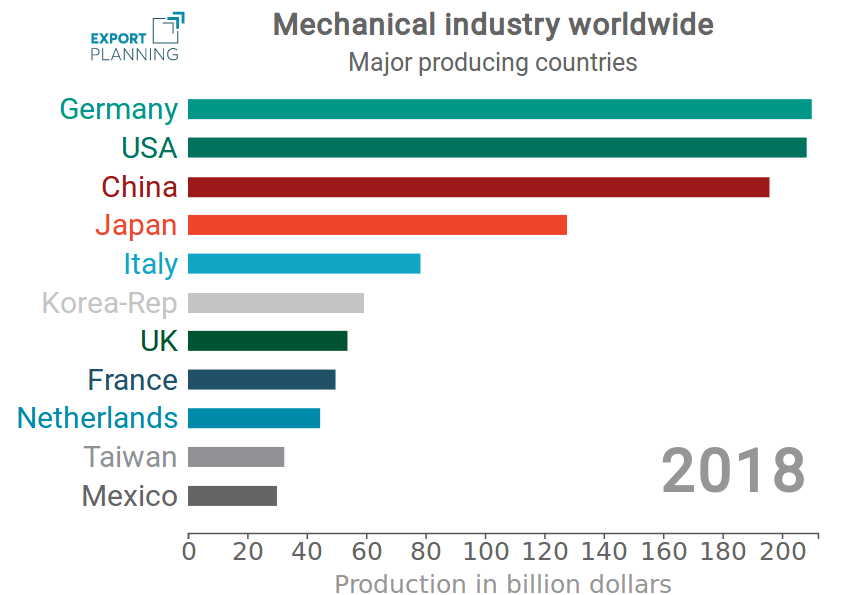
Mechanical industry (net of the means of transport) has not the same weight in every economy. Levels of production derived from international trade flows indicate that Germany, USA and China are on the podium: as you can see from the graph below, the three countries present very high and similar levels of production. Japan follows them in fourth position, slightly apart, while Italy, in fifth position, leads the pursuers.
The first four countries represent almost 50% of the world mechanical industry production, signaling its significant concentration.
1. For each aggregate, the World Demand (given by the sum of world trade) at constant prices has been considered.
You may be interested in:

Extrusion Machinery: Segments and Markets with Highest Export Potential
Published by Marcello Antonioni. .
Metal industry Industrial equipment International marketing Uncertainty Marketselection Foreign markets Export markets Foreign market analysisSeveral markets in structural growth phase, spread across the main segments, support the growth of the sector [ Read all ]
Food Machinery: Segments and Markets with Highest Export Potential
Published by Marcello Antonioni. .
Development stage of Imports Metal industry Industrial equipment International marketing Uncertainty Marketselection Foreign markets Export markets Foreign market analysisNew high for the world trade in the sector, thanks to numerous markets in structural Growth, spread across the main segments [ Read all ]

Metalworking Machine Tools: Segments with Highest Export Potential
Published by Marcello Antonioni. .
Development stage of Imports Metal industry Industrial equipment International marketing Uncertainty Marketselection Foreign markets Export markets Foreign market analysisIn several segments of the Metalworking Machine Tools there is a significant share of markets in a phase of Growth [ Read all ]