World metal trade
World trade flow analysis reveals determinants of strong metal price increases
Published by Donatella Talucci. .
Conjuncture Import Global economic trends
Log in to use the pretty print function and embed function.
Aren't you signed up yet?
signup!
The first half of 2021 was characterised by strong rises in commodity prices. After a strong upward phase, commodity prices have stabilised at their highest levels for ten years.
Among raw materials, metals play an important role in terms of price increases. The graph below shows the development of the StudiaBo indices (average import prices in Europe) from 2000 to 2021, in dollars for both ferrous and non-ferrous categories.
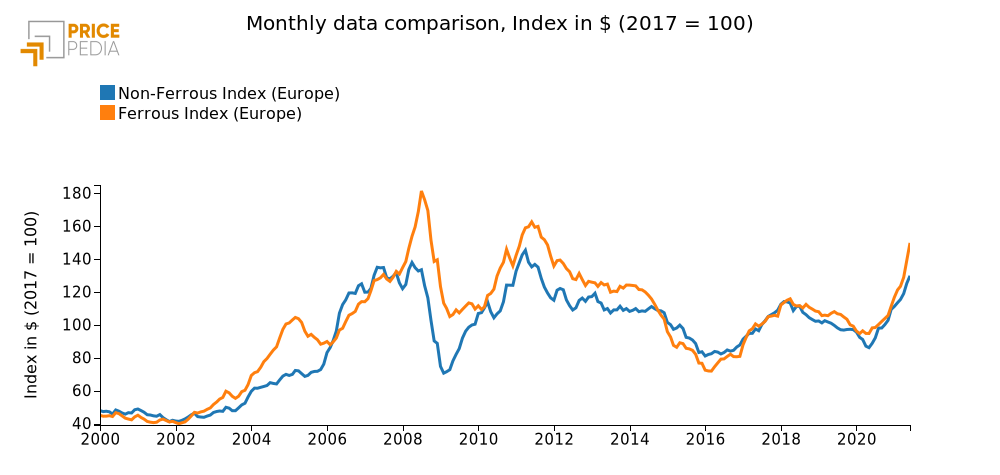
Fonte: PricePedia
The price increase in these categories started already in April 2020, with an acceleration phase, especially for ferrous metals, in the most recent months.
What has caused prices to rise
so exponentially?
Metals are products obtained from the processing of minerals and are used in the production of a wide range of goods. In order to analyze possible tensions between supply and demand along the supply chain, it may be useful to measure the amount of input into the supply chain and the amount of output it generates. If the input is less than the output, it is logical to expect situations along the supply chain where supply is less than demand, generating pressure to increase prices.
The input and output of the metal processing and manufacturing supply chain can be measured using world demand for metal ores and metal products (metal carpentry, domestic appliances, cars, etc.) respectively.
The graph below compares world demand for these two aggregates.
Dynamics of world's metal ores demand and metal products
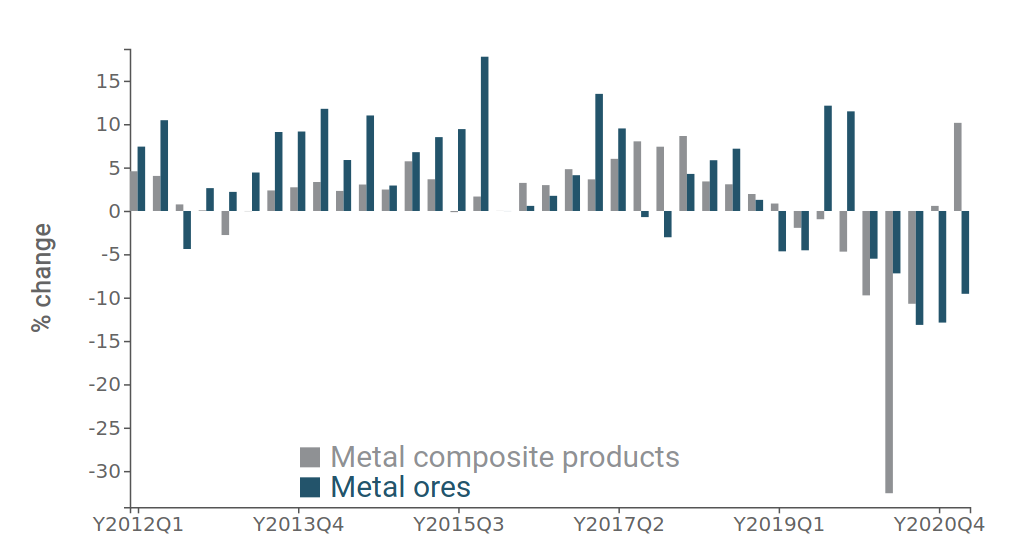
The graph shows the trend rate of change of metal ores (orange bars) and the trend rate of change of demand for products composed mainly of metal (blue bars).
Flow analysis tells us that exchange of minerals (input to metals production) has not yet recovered from the fall in the first half of 2020 determining supply shortages upstream of metals production chains, while exchange of metal products (measure of demand for metals) has recovered quickly from the fall in the first half of 2020 determining excess demand downstream of metals production chains. Minerals recording the largest falls in Q1 2021 compared to the corresponding period in 2020 include iron ore and copper ore, with a negative change of over -13%.
The reporting countries that contributed the most to the decline in demand for iron ore are China (-15%) and Japan (-27%), while the decline in demand for copper ore and other concentrates was again driven by China (-20%) and Japan (-8%), joined by Korea (-10%)[1].
Conclusions
The increase in metal prices is therefore due to the different timing with which the upstream sectors (mining) have adjusted to the recovery in the downstream sectors (goods composed mainly of metal). This tension, at both ends of the chain, has been compounded by tensions along all stages of the chain that have seen buyers procure more than they need, partly to contain the cost effect of price increases and partly for precautionary purposes to secure the materials needed for production. Indeed, in most supply chain markets there appears to have been an endogenous circuit between expectations of price rises, increased purchasing, delayed delivery and increased stock levels for precautionary purposes and so on.
This tension will tend to diminish in the face of two factors:
- A growth of inputs in the production chain, which may be signalled by an increase in foreign trade flows of minerals;
- metal price levels that will reverse price expectations from increases to decreases, leading to a reduction in purchases and a reversal of the circuit described above.
[1]. The countries were selected because they are major importers of iron ore and copper.


