World Trade: the Decline observed in April continues in May
Both April and May data confim a 20% world trade fall
Published by Giulio Grisanti. .
Covid-19 Conjuncture Global demand Uncertainty Global economic trends
Log in to use the pretty print function and embed function.
Aren't you signed up yet?
signup!
Thanks to the latest update of the World Trade Datamart, included in the ExportPlanning Information System (EP), it is possible analyze the effects that the current health crisis is exerting on international trade.
As analyzed in a previous article, the first effects of the pandemic occurred in March, only to show the most significant consequences as the spread of the virus intensified in April.
The graph below shows growth rates of world trade in dollars, calculated by:
- CPB Netherlands Bureau for Economic Policy Analysis, aggregating data on total imports of goods made available by national statistical offices;
- ExportPlanning, taking into account the declarations made by companies in the world's major countries at the 6-digit Harmonized System Customs Code level.
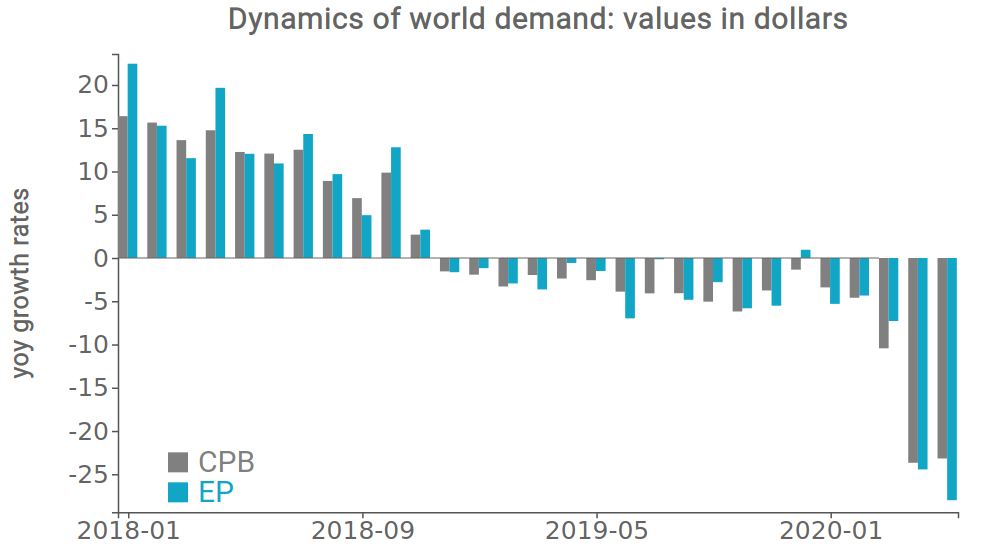
Source: ExportPlanning elaborations
As can be seen from the graph, international trade was already showing signs of weakness from early 2019, due to the protectionist actions of some countries, first and foremost the USA, and a generalised climate of uncertainty. The spread of the pandemic on a global scale has further aggravated an already weak economic situation. In April and May, both sources recorded a contraction in trade close to -25%, indicating a worsening of the crisis that began in March 2020.
It should be noted that world demand measured in current dollars, in addition to taking account of real trade, is affected by changes in prices and exchange rates. If, for example, we consider world trade measured in euros, as shown in the figure below, growth rates are different, sometimes even significantly. For example, world trade measured in euros in 2019 is growing, compared to a contraction measured in dollars.
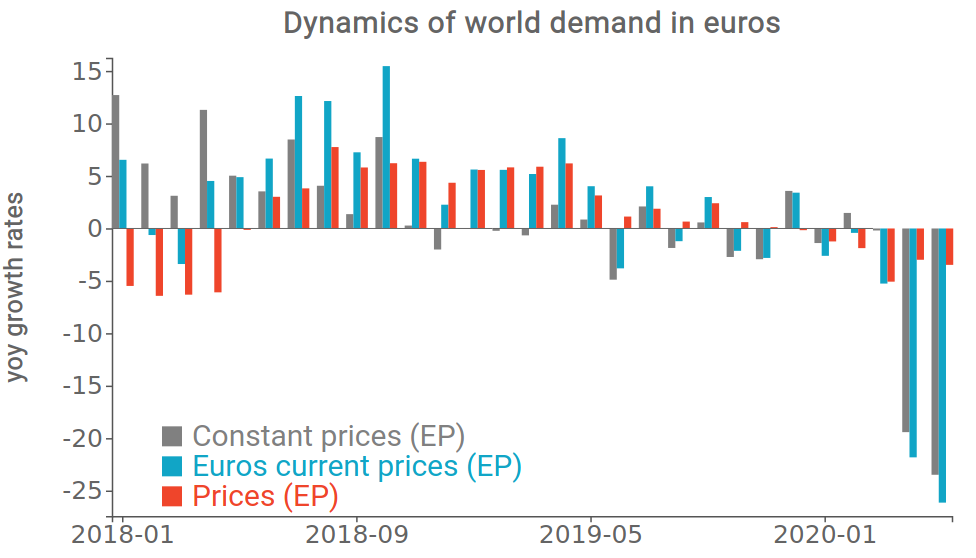
Source: ExportPlanning elaborations
Moreover, as can be seen from the graph, in the first months of 2020 there was a contraction in prices measured in euros; a contraction which, in dollars, was even more accentuated.
One measure that allows international trade to be compared by removing price and exchange rate effects is world trade measured at constant prices.
World trade at constant prices
The graph below shows the dynamics of world trade at constant prices, measured by both EP and CPB.
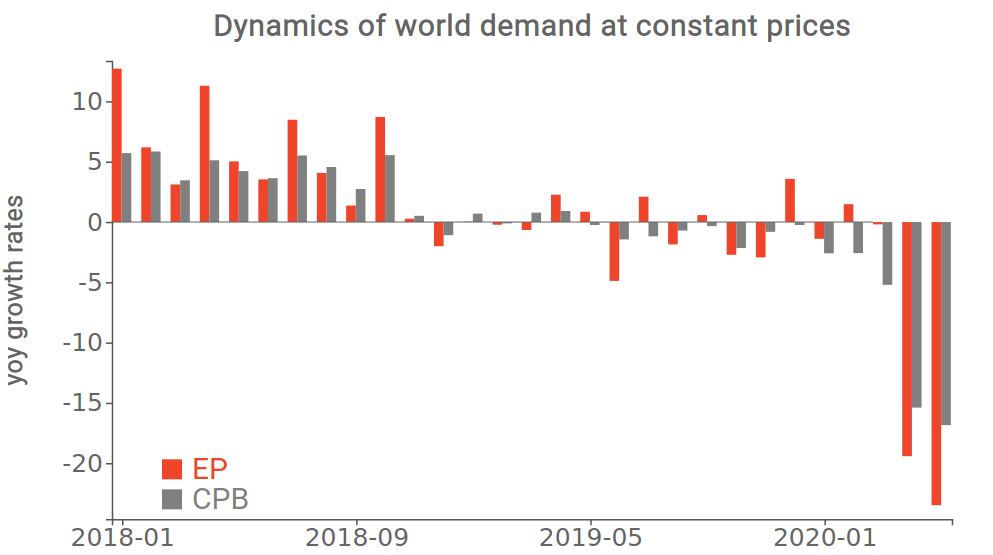
Source: ExportPlanning elaborations
As can be seen from the graph, both sources show a collapse of the order of 20% both in April and, worsening further, in May. The difference in quantity measurement reflects the different methodology used by EP and CPB.
EP uses the import prices, which have shown a contraction since the first months of the year; CPB, on the other hand, uses the production and consumption prices, which were more stable in the first quarter and then showed a decrease in the two-month period April-May.
Looking at the first 5 months of 2020 as a whole, both sources agree in an estimate of a world trade fall amounting to -8.5% in quantity.
Conclusions
The impact of the global health crisis on international trade is similar in intensity to the one shown during the 2008-2009 crisis, but with significant differences in sectoral terms. During the current crisis, the most affected sectors are contact-intensive services, personal transport services and goods, and the most globally integrated manufacturing sectors. The restrictions introduced by the lockdown measures hit these sectors hard, with the most significant collapses during the second quarter. This "ranking" is likely to change significantly over the coming months.
The June estimates and the first assumptions about July suggest a partial recovery from the supply-side shock. The recovery in international trade in the coming months will mainly depend on the speed of recovery in demand.


