Wolrd Trade of Fashion Products: signs of Recovery in the First Quarter
Current levels are still almost 11 percentage points lower than the corresponding 2019 value
Published by Marcello Antonioni. .
Fashion Conjuncture Check performance Global economic trends
Log in to use the pretty print function and embed function.
Aren't you signed up yet?
signup!
After a 2020 that showed a drop of almost 20 percentage points in exports of Fashion products1, measured at constant prices, the first quarter of 2021 finally showed signs of - albeit moderate - recovery, with a year-over-year increase of almost 3 percentage points.
As the chart shows, the 2020 result was strongly compromised by the collapse that followed the Great Lockdown experienced by the Western world in the Q2-20, which occurred after a first quarter that was already in a sagging phase. Between March and June of last year, there was a y-o-y drop of 40% at constant prices. Moreover, in the second half of the year, although a progressive recovery, the world trade of Fashion Goods had not in any way reversed the negative trend.
Data recently made available in the ExportPlanning Information System show a first quarter 2021 in positive counter-trend: the trend change is still modest (+2.7% at constant prices) and, above all, it is compared with a first quarter of 2020 that was already in deficit - due to the spread of the Coronavirus in Asia and the consequent blocking of economic activities, already in February.
To drive global demand for Fashion products were essentially three markets: China (+4. 1 billion compared to the first quarter of 2020, or +61.5%)2, United States (+2.4 billion euros)3 and Hong Kong (+2 billion euros).
Despite the trend recovery, the distance to the pre-crisis period averages almost 11 percentage points...
Therefore, a more appropriate way to measure the current conditions of global demand for Personal Fashion System products is to compare the figure for the first quarter of 2021 with that for the corresponding period in 2019: the result is a deficit of 10.7 percentage points, if measured at constant prices.
... which becomes close to 20 percentage points
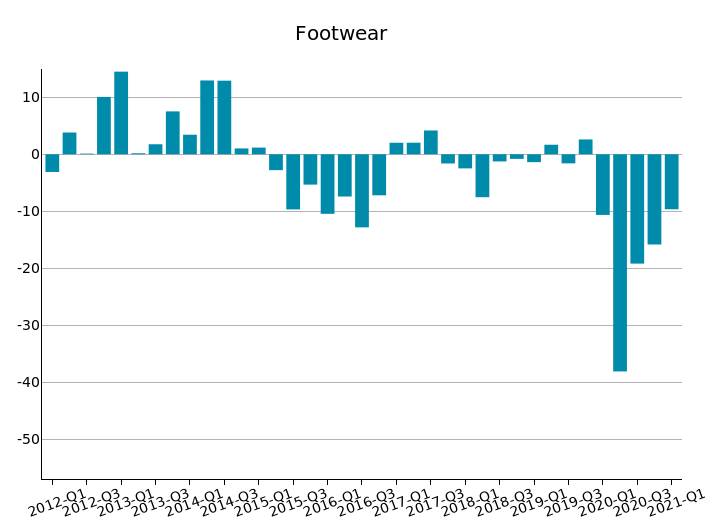
for Leather Goods and Footwear...
In the Leather Goods4 and Footwear5 sectors, the distance to pre-crisis levels appears particularly significant, amounting respectively to -19.4% and -19.2% compared to the first quarter of 2019, measured at constant prices.
In particular, both sectors continued to record negative trends in the first part of the new year as well: measured at Leather Goods -8% and Footwear -9.6%, at constant prices.
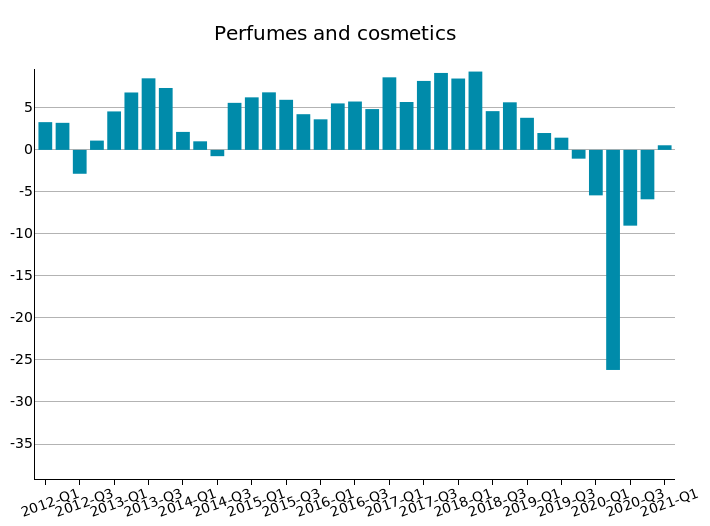
...while it significantly decreased for Profumes and cosmetics
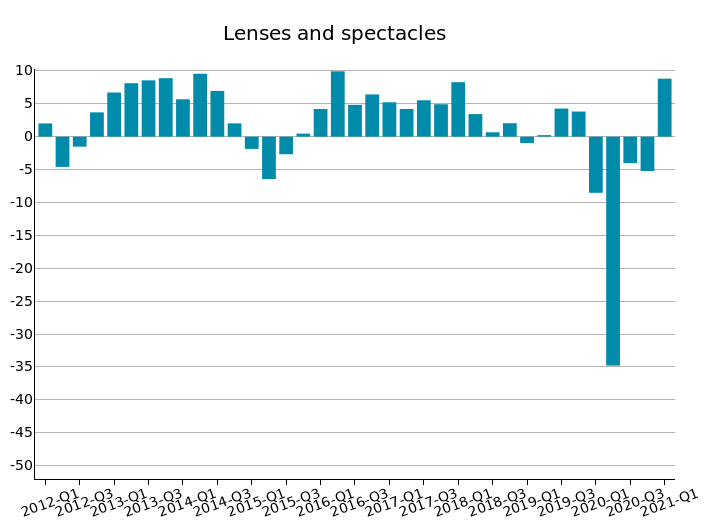
and even went down to zero for Lenses and eyewear.
Rather circumstantially, the gap to pre-crisis levels for the Profumes and cosmetics6 sector, which -complicated also by the weakly positive result in Q1 2021 - marks a -4.9% compared to Q1 2019 at constant prices.
Rather, thanks to a truly significant Q1 result (+8.8% at constant prices), the Lenses and Eyewear7 sector shows that it has almost completely recovered 2019 levels (just -0.5% at constant prices).
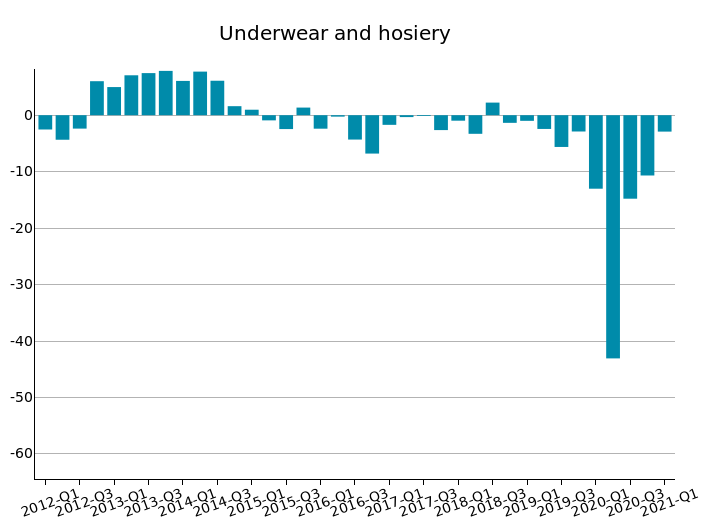
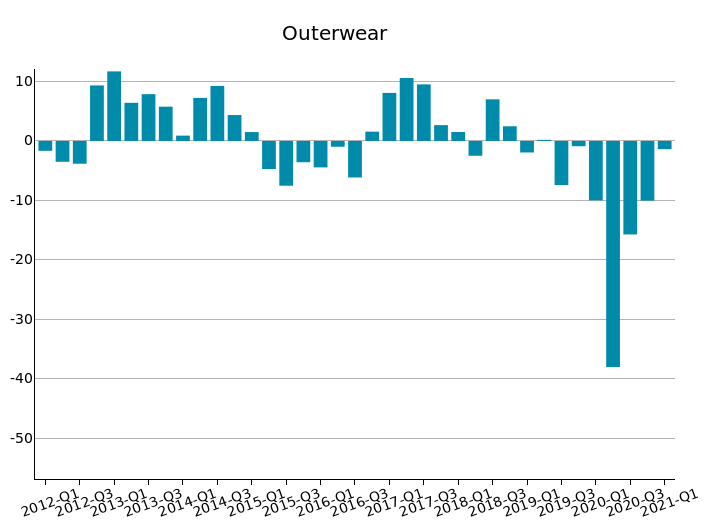
The deficit with respect to 2019 is, finally, between 11 and 15 percent for Underwear and hosiery and Outwear
Almost aligned trends for the Outerwear8 sectors (with a deficit of more than 11 percentage points compared to 2019) Underwear and hosiery9 (-15.5 percent at constant prices). In both cases, the first quarter of 2021 confirmed sagging dynamics of world exports measured at constant prices: Outerwear -1.4%, Underwear and Hosiery -2.9%.
|
|
|
|
|
|
Source: ExportPlanning - Market Research - Analytics, World Trade Datamart
1) See the list of the sectors included in this industry in the related industry's description.
2) In the case of the Chinese market, in addition to the considerable trend increase, there is also an increase of +4.1 billion compared to the pre-recession period (Q1-2019).
3) In contrast to the Chinese market, the U.S. market, while showing a good trend recovery in Q1-2021, still shows levels 9 percentage points below pre-crisis levels (Q1-2019).
4) See the list of the products included in this sector in the related sector's description.
5) See the list of the products included in this sector in the related sector's description.
6) See the list of the products included in this sector in the related sector's description.
7) See the list of the products included in this sector in the related sector's description.
8) See the list of the products included in this sector in the related sector's description.
9) See the list of the products included in this sector in the related sector's description.


