World trade performance by free trade areas in H1-2019
World trade does not lose ground in the first half of the year, but shows different growth intensities by area
Published by Marzia Moccia. .
Free trade agreements NAFTA Asia Conjuncture Oceania Global demand South-east Asia Eurozone Global economic trends
Log in to use the pretty print function and embed function.
Aren't you signed up yet?
signup!
After the strong slowdown recorded during the second half of 2018, the dynamics of world trade measured at constant prices in dollars during the first half of the year signaled a substantial stability compared to the same period of last year, as anticipated in the article "Has the Global Economic Slowdown Stopped?".
However, an analysis of trade flows by geographical area shows different intensities in relation to the area they belong to.
The table below shows the trend at constant prices of international trade in the first half of the year by geographical areas. We will focus on three free trade areas: European Union, North America (United States, Canada and Mexico; currently subject to the NAFTA, which will be replaced by the USMCA in 2020) and Pacific Asia1. The rest of the world (ROW) is considered as a residual category. The graph shows, in column, the areas of origin of the commercial flow and, in row, the destination areas. The size of the ball is proportional to the value of the trade flow recorded in 2018; the color of each ball represents the year-over-year growth rate recorded in H1-19.
Fig.1: World trade by geographical areas
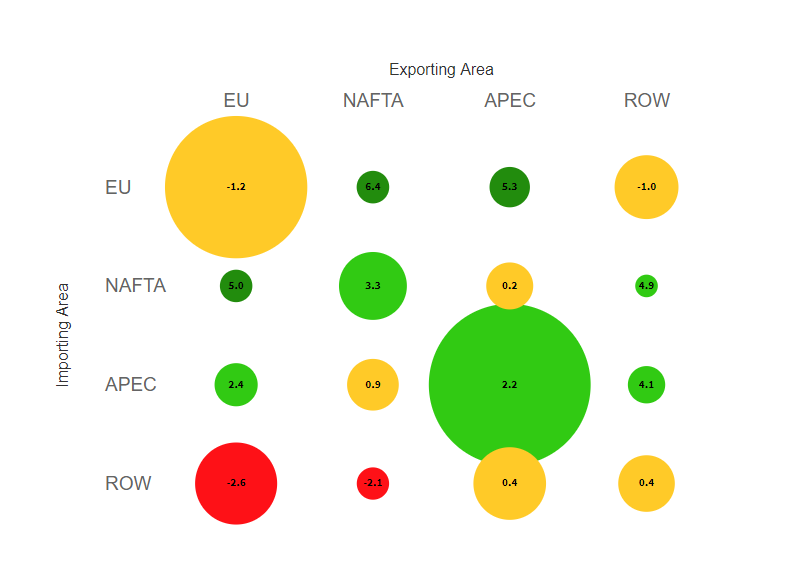
Source: ExportPlanning.
As shown in Fig.1, the most significant slowdown was recorded in intra-EU trade, which reported a 1.2% decline at constant prices compared to the first half of last year. The results can be attributed both to a normalization phenomenon, following the growth recorded between 2017 and the beginning of 2018, and to the current weakness of the Eurozone, mainly attributable to the German economy slowdown and the Brexit uncertainty.
Substantial stability is also signaled for trade flows between the Asian economies and North America. This dynamic is recorded both by the import and export flows between the two areas, thus signaling that this result is linked to the US-China trade war. The results show a relative resilience to the international context, and is partly due to a substitution effect in favor of third countries that took place both on American and Chinese markets.
In the remaining cases, there was a generalized positive trend: in the case of intra-area flows, both intra-Asian trade and those within the North America area grew. However, the most dynamic cases of increase are evident for bilateral EU-North America flows: European exports to North America have grown by 5% at constant prices, and EU imports from the North America region have increased by 6%.
Conclusions
The analysis suggests that, although it is slowing down, the dynamics of world trade do not seem to be losing ground for the moment. However, the prospects for the second half of the year will depend heavily not only on the forthcoming developments of US-China trade tensions, but also on Eurozone economic recovery and the resumption of international investment flows.
1. Pacific Asia includes the regions of South Asia, Southeast Asia, East Asia and Oceania.


