DailyDataLab: a New Tool to Dig out Information from the Financial Mine
The new project born from the collaboration between ExportPlanning and PricePedia to monitor daily data
Published by Alba Di Rosa. .
Covid-19 Europe United States of America Data visualization Global economic trends
Log in to use the pretty print function and embed function.
Aren't you signed up yet?
signup!
Our latest project, that has been online for a few days now, is DailyDataLab, a platform aimed at a daily monitoring of economic and financial phenomena through data visualization tools. The platform was jointly developed by the ExportPlanning and PricePedia teams, and can also be accessed through the "Market Monitor" section of ExportPlanning.
DailyDataLab can help economic operators and analysts to be always up to date with the latest development in their topics of interest. Specifically, the main themes covered in the tool are as follows:
- Exchange rates (effective, against the dollar and against the euro)
- Stock exchange indexes
- Commodity prices
- Interest rates (10-year sovereign bond yields and monetary-policy related interest rates)
- Electricity consumption during working hours which, according to recent economic literature, can be considered a proxy for a country's industrial production
The website is therefore a lab that allows the user to dig out autonomously, from daily information, signals on the state of health of the world economy.
The website is structured in two sections, in order to meet different user needs. The "Overview" section uses data visualization tools to provide a bird’s-eye view of the most recent evolution of the different phenomena; on the other hand, the "Analytics" section allows to deepen and customize the study of the variables of interest, by selecting different time series for many countries and comparing them through line and bar graphs.
The majority of data available on the platform stems from financial markets, e.g. forex market for exchange rates, stock exchanges, bond markets for public sector securities, as well as commodity markets for commodity prices. The innovative element of the platform is the possibility to display not just the graph of the single time series or its transformations, but also to compare different series of quotations on the same market, as well as different markets. Through the comparison of the dynamics of assets of different nature, it is possible to extract a general sentiment that financial markets express day after day.
From this point of view, financial markets can be considered a huge open-air and freely accessible mine of information. Through DailyDataLab, the access to this information becomes immediate and relatively simple. An example can clarify its potential.
Generalized market blues in the first weeks of September
A use case of DailyDataLab data is the analysis of some of the most popular American stock market indexes.
DailyDataLab: Overview section – US Stock Exchange Indexes
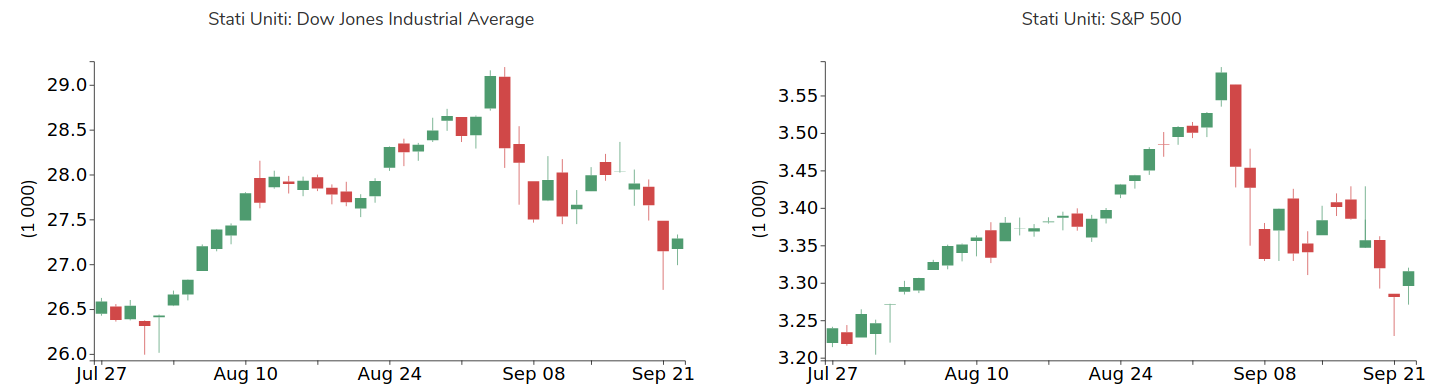
As can be seen at a glance in the "Overview" section of the platform, two of the most popular American stock market indexes have shown a turnaround since September. You can examine this dynamics in depth by accessing the complete time series, available in the "Analytics" section of DailyDataLab. You can plot together different series, which are indexed (2020 = 100) if their units of measurement are not directly comparable.
DailyDataLab: Analytics section – US Stock Exchange Indexes
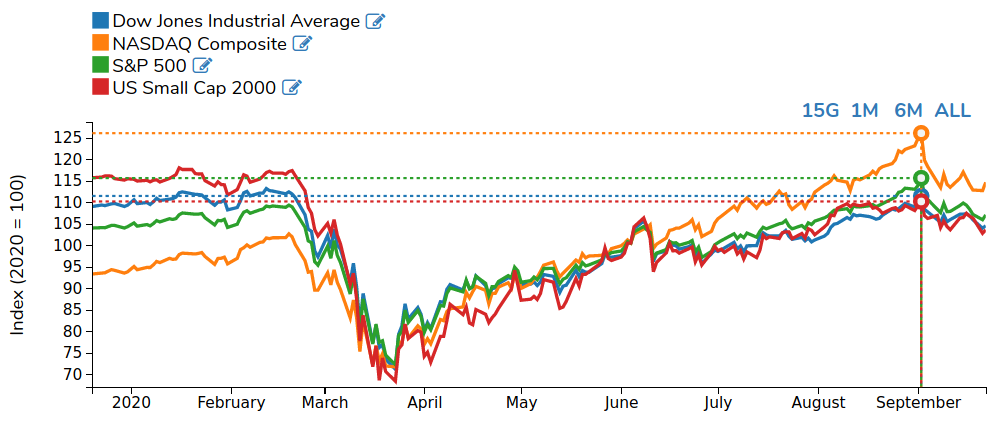
As can be seen from the graph, the main US stock market indices have experienced similar dynamics during the period considered, from the beginning of 2020 to the present, showing a collapse with the start of the pandemic in March and a progressive recovery in the following months. The recovery was particularly marked for the S&P 500 and NASDAQ which, in their end-of-summer peak, exceeded their pre-crisis levels.
What these indices have in common is also the start of a downward trend in September, as we noted in the candlestick charts above, which could be due to several factors - national, international or strictly financial.
- Among the elements related to the United States, we can find the delays in the approval of a new fiscal stimulus package to support the economy during the Covid crisis: in the absence of such support, the economic difficulties of the country could be exacerbated. Continuous tensions with China and an intense electoral campaign spread a climate of concern on financial markets, as well.
- As far as international factors are concerned, markets have been affected by the increase in Covid-19 cases, especially in Europe, the threat of new restrictions and the consequent damage that is feared for the economy, due to a failure to return to normality.
- At the financial level, this market downturn can also be read as "physiological" realignment, after the almost continuous rally that followed the March collapse, especially for the S&P 500 and NASDAQ, as mentioned above.
The aftermath of the yet-to-be-overcome Covid crisis can also be read from oil prices, which in turn recorded a fall in the first part of September, only to show a partial recovery in the last week.
DailyDataLab: Analytics section – Oil prices
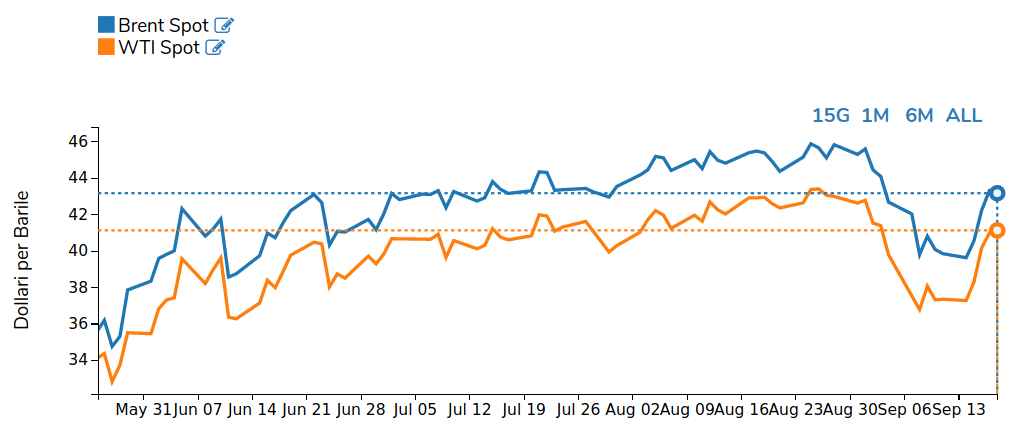
After a recovery in the summer months, driven by optimism about the slow recovery in oil demand, the price of crude oil fell again in early September, mainly due to the deep market uncertainty. The second wave of Covid-19 in Europe and the increase in confirmed cases in the rest of the world raise serious concerns about the recovery of demand to pre-pandemic levels, in the face of an oversupply that has not yet been reabsorbed. Last week's recovery, which brought oil back to $40, is linked to the last OPEC+ monitoring committee meeting, which did not disappoint market expectations, urging members to meet their commitments to cut production.
The most significant element is the simultaneous decline in the US stock market indices and the price of oil in the first half of September.
DailyDataLab: Analytics section – WTI Spot and NASDAQ Composite
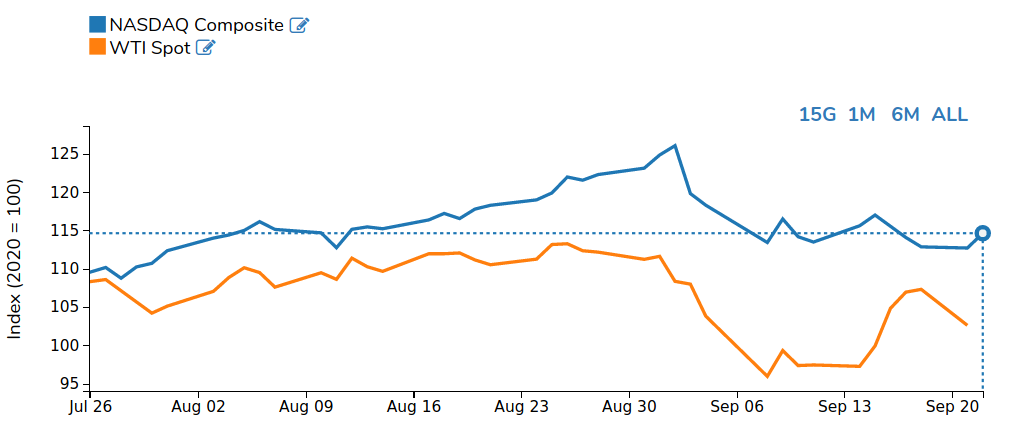
This alignment shows that, between the end of August and the beginning of September, a generalized shift in sentiment on the short-term outlook for the world economy has consolidated on financial markets, turning less positive than the one prevailing during summer. At the basis of this change is the evolution of the pandemic, which between August and September was characterized by:
- The interruption of the downward trend in new cases in the United States
- The start of second waves in some European countries, in particular Spain and France
- The inability of some developing countries (first of all Brazil and India) to stop the first wave of contagion
Access DailyDataLab and browse our data!
Do you need more information? Do not hesitate to contact us.