World Trade surpasses Projections: Growth intensifies in Q2-2021
In the second quarter of 2021, growth in global demand continued and registered a 7% increase in quantity over Q2-2019
Published by Simone Zambelli. .
Conjuncture Global demand Forecast SME Global economic trends
Log in to use the pretty print function and embed function.
Aren't you signed up yet?
signup!
The latest update of world trade data provides a clearer picture of the dynamics that are characterizing international trade. As reported on several occasions, the strong contraction that occurred in the spring of 2020 (in particular, April and May recorded a year-over-year fall greater than 20%) was followed by a rapid recovery that, in the final months of the year, brought world demand back to the corresponding pre-crisis levels. In 2021, on the other hand, an effective systematic growth began and is now even exceeding expectations.
The graph below shows the year-over-year changes (compared to the corresponding month of the previous year) in global demand for goods in dollars, comparing the information processed by the institute CPB|Economic Policy Analysis with ExportPlanning data.
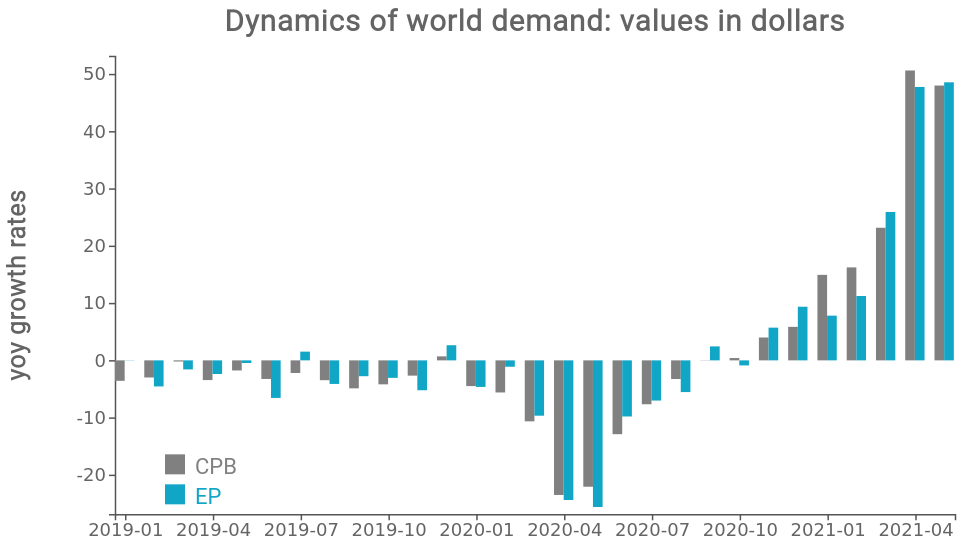
Source: ExportPlanning elaborations.
The graph shows the substantial alignment of the dynamics of the two series, as a guarantee of the reliability of the results.
As expected, the very strong positive change in April and May 2021 can be partly explained as a mere statistical "base effect": the year-over-year growth rate is in fact calculated with respect to the months of greatest economic crisis during the Great Lockdown. Nevertheless, comparing Q1-2021 with the corresponding quarter of 2019, we can infer a 11% increase in dollar terms. Overall, in the first half of 2021, trade growth in dollars is therefore estimated to amount to +10% over H1-2019.
In order to get rid of the price effect, it is particularly useful to analyze the dynamics of global demand at constant prices, as well.
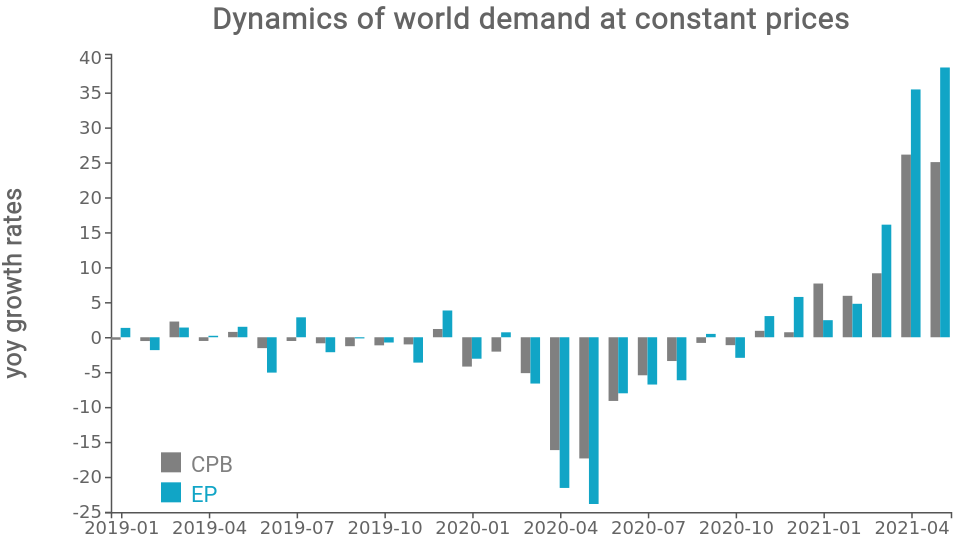
Source: ExportPlanning elaborations.
Also in this circumstance, the two series are substantially aligned, although some differences emerge related to the different methodology used by the two institutes [1].
As with the previous chart, in order to make more accurate assessments of the actual global trade expansion, it is necessary to compare 2021 values with those recorded in 2019. In Q2-2021, we can see an excellent 6.6% increse in terms of quantity, which is expected to grow by over 7% in the following quarters. Looking at H1-2021, estimates reveal a 5.5% increase, which is also expected to increase in the second half of 2021.
A look at PMI
A further indicator of economic performance that is characterizing this post-pandemic historical period, as well as an anticipator of world trade, is the Purchasing Managers' Index (PMI) for the manufacturing industry. This index summarizes the expectations of expansion of manufacturing production based on purchases by buyers of the various companies active in the market. The chart below shows the latest update of the PMI Index through June 2021.
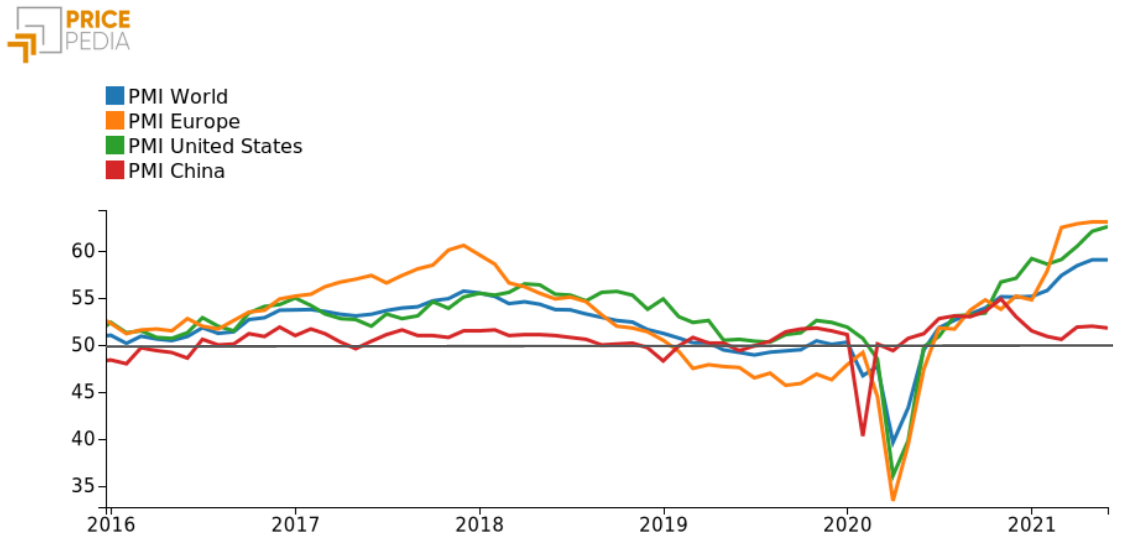
The graph shows how a phase of slight decline had already begun in 2019, especially for the European area, with a PMI below the critical threshold of 50 since the beginning of the year. In the period of the Great Lockdown, we can see the fall of Chinese PMI as early as February 2020, due to its role as epicenter of the first wave of the epidemic; for the rest of the world, the negative peak occurred in April and May.
From July 2020 onwards, the PMI Index has not fallen below the 50 threshold. It should be noted that China anticipated the recovery as early as March 2020 and, for this reason, suffered a slowdown in H1-2021, although remaining at 52. On the other hand, EU and US PMI, as well as the one calculated at a global level, reached extremely high values in recent months, after the hard blow suffered from the Sars-Cov-2 pandemic, and therefore confirming the expectation of expansion for the near future.
Conclusions
The analysis just conducted on global demand dynamics confirms that the rebound of the global economy after the pandemic crisis is continuing at an even faster pace. The growth rates shown for both last year and 2019 are far above expectations; further improvements are expected in the coming months. Based on ExportPlanning's nowcasting models, updated to the most recent data, the estimated growth for 2021 amounts to +17% in dollars and +13% in quantity, compared to 2020. Compared to 2019 levels, growth rates respectively amount to +10% in dollars and +6.5% in quantity.
In light of the data gathered so far, a path of strong recovery emerges in the field of world trade; this could outperform the current expectations of international forecasters, who assume a volume growth in the range of 8-10%. In addition, signals coming from the PMI index show how the "momentum" could progressively expand in the coming months, confirming the expansive expectations that have characterized 2021 so far.
[1] Several methodologies exist to carry out this deflation. CPB deflates a country's total dollar trade with a price index obtained by considering the exchange rates of the various currencies and inflation in the various countries, derived from consumer, wholesale, and producer price surveys. ExportPlanning uses appropriate price indices obtained using average unit values at the individual 6-digit Harmonized System code level.


