The Dragon's slowdown: industry-by-industry analysis of Chinese imports
Data for the first nine months of the new year signal how the Dragon's recovery is still trudging along
Published by Simone Zambelli. .
Slowdown Asia Foreign markets Foreign market analysis
Log in to use the pretty print function and embed function.
Aren't you signed up yet?
signup!
Monitoring of international trade data outlines an economic situation that is still slowing considerably, as documented in the article A Slowing global Trade: a Geographical and Sectoral profile.
In this picture, China appears as the "worst performing" country, showing large declines in its imports.
China had already ended the year in negative territory in 2022, penalized by closures imposed in the face of zero-Covid policy. Major international commentators therefore expected a robust recovery in 2023, which not only does not seem to be materializing, but increasing signs of continued weakness.
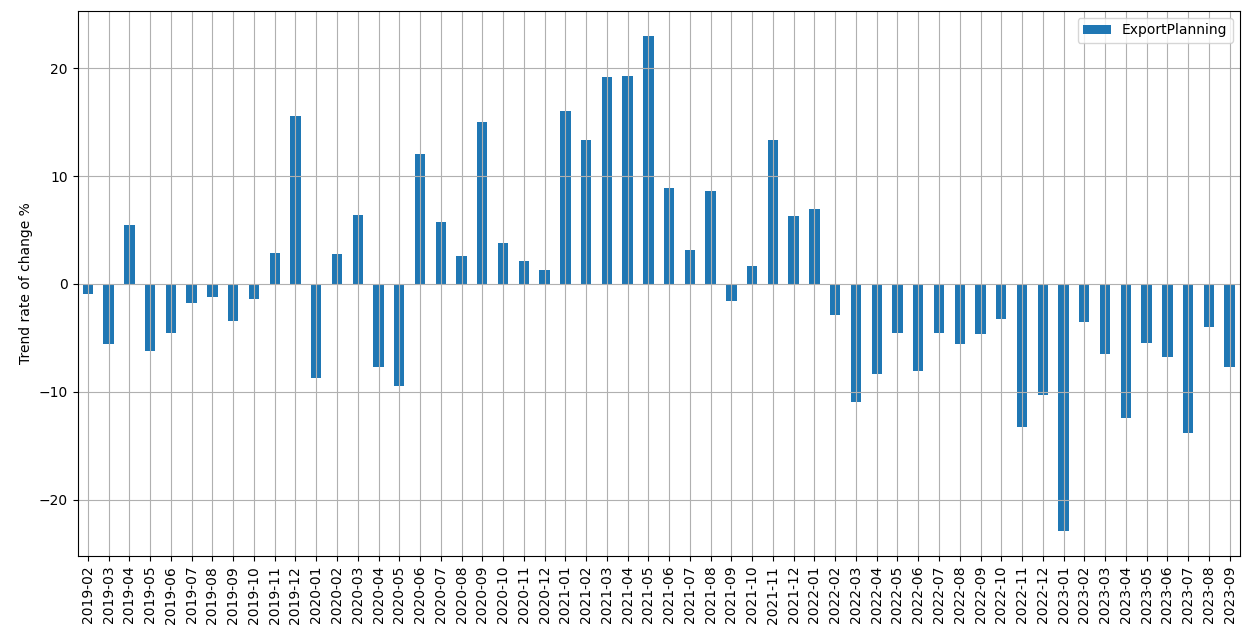
The following figure makes this dynamic clear by showing the monthly trend changes in current dollar prices of data on China compiled by ExportPlanning and the Central Planning Bureau, an institute that in turn collects and processes information on international trade in goods.
Fig.1 - Trend changes in current prices of Chinese imports
(CPB - ExportPlanning Comparison)

Source: ExportPlanning.
It is apparent that both measures reported are very similar to each other, certifying the robustness of the ongoing phenomena. As the chart shows, as of November 2022, the Dragon's imports are firmly in negative territory, with double-digit declines.
Particularly informative is the series of changes in constant prices of Chinese imports, i.e., stripped of price and exchange rate changes.
Fig.2 - Changes in constant prices of Chinese imports
Source: ExportPlanning.
Changes in constant prices are smaller than those in nominal prices, testifying to how the double-digit declines in current dollars can be attributed, in part, to the reduction in prices, which is affecting commodities in particular. In any case, Chinese imports in quantity remain in negative territory, showing substantial continuity with 2022 figures. In fact, based on the 2023 ExportPlanning pre-estimates, China is expected to end the year with a -3.3 percent decline in quantity, a figure in line with expectations from the International Monetary Fund, which estimates a 3 percent contraction in volume.
In light of what has been observed, it is interesting to analyze which sectors are slowing down the most. The graph below positions the different industries of Chinese imports, placing on the y-axis the trend change recorded between the first nine months of 2023 and the same period last year, and on the x-axis the annual trend change relative to 2022 over 2021. The comparison between the two was introduced in order to identify which sectors in 2023 are further slowing down from the previous year; the magnitude of the balls is proportional to the dollar value of Chinese imports in 2022.
Fig.3 – Chinese imports by industry: changes at constant prices
By hovering the mouse over the circle that identifies an industry, a table summarizing the trend change data for the selected industry can be displayed
Source: ExportPlanning - Datamart World Conjuncture
Commodities (A1 and A2) confirm last year's difficulties, but do not aggravate them.
Capital goods also remain on the changes recorded in 2022, highlighting how the investment policies of local businesses still do not seem to be recovering.
In wider fall all consumer goods, with the only exception of Health Products and Tools (E4), a symptom of a health care environment that is not yet risk-free.
Recording the most significant declines are mainly intermediate goods, testifying to the difficulties in manufacturing and more prudent purchasing policies by companies. Among them all, the sector that is dragging down the negative performance of the entire industry is Electronic Components. The result can be attributed to the effects of the Washington-Beijing technology clash, and the ongoing decoupling process between the two sides of the Pacific.
In fact as a result of the trade war, all of the country's major trading partners (in order Taiwan, South Korea, Vietnam and Malaysia), have drastically reduced their exports to Beijing, deciding to invest elsewhere, as shown in the chart below.
Fig.4 - Chinese imports of electronic components

Source: ExportPlanning.
At the same time, on the other hand, Taiwan's Electronic Components exports to the Mexico+U.S. region are gradually growing.
Fig.5 - MEX+US imports of electronic components from Taiwan

Source: ExportPlanning.
Conclusions
The recovery of the Chinese economy still seems to have a highly fragile character and raises serious questions about the future pattern of economic growth in the Dragon country, marked by short- and long-term challenges. The significance of the "Chinese knot" in the possible future recovery of global demand is increasingly significant. It must be highlighted, however, how the country's policy goal in recent years is to strengthen domestic production, especially in more advanced sectors, to be less exposed to geopolitical decisions of the West.
The next few months will be crucial in determining whether the Dragon country is ushering in a phase of structural slowdown or whether it will find the right key to building the growth of the future.


