World Exports of Household Products: new Year-over-Year decline in the fourth quarter of 2023
The recessionary phase of global household product continued in the most recent quarter, from upstream to downstream of the supply chain
Published by Marcello Antonioni. .
Slowdown Home items Conjuncture Check performance Export Global economic trendsWorld trade data for the fourth quarter of 2023 (StudiaBo pre-estimates), available in the ExportPlanning Information System, confirm the difficult phase of international sales of products in the home supply chain, both upstream (in the context of building goods and products1) and downstream (with reference to finished products for the home2).
In particular, in the period October-December 2023 (pre-estimates) world exports - measured at constant prices3 - of products in the home supply chain have achieved the eighth trend decline, on a quarterly, consecutive basis, with a drop close to -3% compared to the fourth quarter of 2022.
In the most recent quarter, the trend in global exports at constant prices concerned
almost all sectors of the Home supply chain...
This decline is common to both sectors analyzed and to most of the sectors included therein, described below.
Construction goods and products
As documented in the table below, in the fourth quarter of last year, world exports of goods and construction products showed, for sixth consecutive quarter, a new trend decline at constant prices.
..with a y-o-y drop of 7.2 percent in the
goods and construction products sector...
World Exports of Building Materials and Products
| Values (Bn €) | % Y-o-Y changes at constant prices |
|||||
| Sector | 2023E | 2022 | H1-2023 | Q3-2022 | Q4-2023 | 2023E |
| Faucets and Valves | 57.5 | + 1.2 | - 5.6 | - 8.7 | - 3.1 | - 5.8 |
|---|---|---|---|---|---|---|
| Flooring | 34.7 | - 7.5 | -14.9 | -11.9 | - 5.7 | -12.1 |
| Doors and windows | 32.5 | + 1.8 | - 9.8 | - 7.6 | - 4.4 | - 8.0 |
| Sanitaryware and other bathroom products | 15.1 | - 7.1 | -22.8 | -23.0 | -19.4 | -22.0 |
| Other building materials and products | 48.2 | - 3.3 | -12.8 | -13.0 | - 9.7 | -12.1 |
| TOTAL | 188.0 | - 2.6 | -11.8 | -11.7 | - 7.2 | -10.7 |
Source: ExportPlanning-World Trade Datamart
The downward trend in world exports at constant prices affected all the main sectors of goods and construction products.
The most penalized sector appears to be that of sanitaryware and other bathroom products4, with a trend decline in the quarter more recent than 19 percentage points in the measurement at constant prices, which also follows a trend decline in the first 9 months of next year to 23 percentage points (after -7.1 percent in 2022, demonstrating the fact that the phase of ongoing downsizing has a long "tail" in this sector).
Furthermore, we note the trend reductions in world exports - measured at constant prices - of flooring5 (- 5.7% compared to the fourth quarter of 2022, leading to a pre-final result for the year of -12.1 percentage points compared to the 2022 average), doors and windows6 (-4.4%), faucets and valves7 (-3.1%), as well as other building materials and products (-9.7%).
Household Products
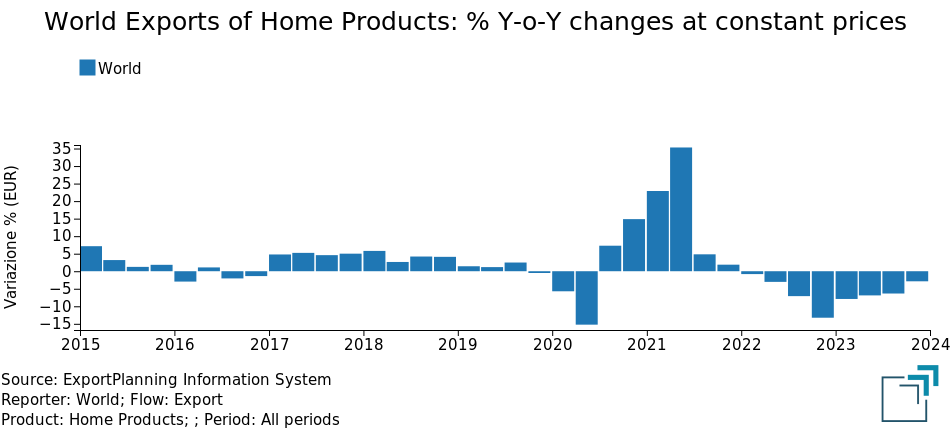
Even in the finished products for the home sector, the fourth quarter of 2023 (see the table below) marked, for the eighth quarter consecutive, a new trend reduction in world exports measured at constant prices.
...and relatively less penalizing trends (-1.9%)
in finished products for the home.
World Exports of Household Products
| Values (Bn €) |
% Y-o-Y changes at constant prices |
|||||
| Sector | 2023E | 2022 | H1-2023 | Q3-2022 | Q4-2023 | 2023E |
| Consumer Electronics | 187.1 | - 6.2 | - 0.3 | + 0.7 | - 1.4 | - 0.3 |
|---|---|---|---|---|---|---|
| Household Appliances | 172.9 | - 9.3 | - 8.8 | - 8.0 | - 2.5 | - 7.2 |
| Furniture and Furnishings | 91.3 | - 8.4 | - 8.1 | - 0.3 | + 1.2 | - 4.0 |
| Lighting Technology | 57.7 | -11.5 | - 8.2 | -14.6 | -12.8 | -11.1 |
| Home Textiles | 44.3 | - 2.1 | - 3.6 | + 5.0 | + 7.4 | + 1.3 |
| Other household products | 229.1 | - 2.1 | - 8.6 | - 9.7 | - 2.2 | - 7.3 |
| TOTAL | 738.0 | - 7.1 | - 6.3 | - 5.1 | - 1.9 | - 4.9 |
Source: ExportPlanning-World Trade Datamart
The trend performance of world exports at constant prices also highlighted differentiated trends for the sectors of finished household products.
In the preliminary final balance of 2023, the sectors most penalized appear to be those of lighting technology8, with an average decline annual increase of more than 11 percentage points when measured at constant prices, and very unfavorable recent signals (-12.8% trend in the most recent quarter), household appliances9, with an average annual decline of more than 7 percentage points when measured at constant prices, confirming the declining phase already experienced in the average of 2022 (-9.3%), and other household products (-7.3% on average in 2023).
We also note the average annual reductions in world exports - measured at constant prices - of furniture and furnishings10 (-4.1% compared to the 2022 average), but with recent signs of a reversal (+1.2% trend in the fourth quarter of 2023) and, to a lesser extent, of consumer electronics11 (-0.3% compared to 2022).
However, global sales of home textiles12 (+1.3% compared to the first quarter of 2022), with above all accelerating trends in the most recent period: +5% in the third quarter of the year, +7.4 percent in the most recent quarter.
Conclusions
The fourth quarter of 2023 confirmed what had already been highlighted during the first 9 months of the year and in the second part of last year (which had closed 2022 with a decline of 6.3 percent, when measured at constant prices), with a new decline in global exports of household products, still widespread in many sectors of this industry.
This evidence clearly shows how, after the strong growth achieved during the pandemic period (benefiting from an "exceptional" shift in consumer preferences in favor of purchases linked to home living), global sales of the home supply chain have reflected - in exit from the pandemic emergency - a physiological readjustment of consumption habits by the international community, oriented more towards mobility and opportunities for socializing outside the domestic environment.
Added to this physiological readjustment was also a worsening of family consumption, due to the phenomena of inflation and increase in interest rates, which has certainly significantly affected global sales of supply chain.
The housing system in 2024: prospects for slow recovery,
with the need to select the best market opportunities
The recent phase of disinflation, expected to continue in the coming months and allow a less restrictive stance of the monetary policies of the main central banks, should allow a progressive improvement in the demand framework for exporting companies in the Home Products industry, which however will likely be uneven at a sectoral and geographical level.
Thanks to the series of services Market Insights, ExportPlanning can support the definition of the 2024 budget (and its progressive monitoring) of exporting companies, providing updated information in real time on the historical and forecast evolution of the markets of interest for a given strategic business unit.

1) For a description of the sectors included therein, see the related industry profile.
2) For a description of the sectors included therein, see the related industry profile.
3) The measure Quantities at constant prices (Q). This measure includes a deflation operation, in which the historical series of monetary values (V) has been transformed into an analogous series of values expressed at constant prices, with a reference to a given year, known as the base year. For a description of the methodology applied, please refer to Methodological Note on the World Trade Datamart.
4) For a description of the products included therein, see the relative sector profile.
5) For a description of the products included therein, see the relative sector profile.
6) For a description of the products included therein, see the relative sector profile.
7) For a description of the products included therein, see the relative sector profile.
8) For a description of the products included therein, see the relative sector profile.
9) For a description of the products included therein, see the relative sector profile.
10) For a description of the products included therein, see the relative sector profile.
11) For a description of the products included therein, see the relative sector profile.
12) For a description of the products included therein, see the relative sector profile.
You may be interested in:

Blue jeans, shifting geographies: the challenge faced by new manufacturing Countries to China and Bangladesh
Published by Mauro Badanelli. .
Fashion Export Foreign markets International marketingBlue jeans: an iconic fashion product Blue jeans are one of the iconic products of the apparel industry, with a well-established presence in markets around the world and demand spanning generat}... [ Read all ]
Dyeing machinery: innovation and sustainability at the heart of a changing supply chain
Published by Mauro Badanelli. .
Industrial equipment Export Foreign markets International marketingDenim is one of the cornerstones of the global apparel industry. Every year, billions of garments are produced and sold worldwide, fueling demand from fast fashion brands, premium manufacturers, and}... [ Read all ]

US Trade Deficit Put to the Test by Tariffs: Evidence from First-Half 2026 Data
Published by Marzia Moccia. .
Slowdown Conjuncture United States of America Uncertainty Trade war Foreign market analysisAmid uncertainty that has now become the new normal, international geopolitical tensions, and the reshaping of the rules governing global trade, the United States undoubtedly remains a key focus of }... [ Read all ]