Investment Goods: A Look at US Exports
Machinery exports touch record high in 2021Q1 due to surging semiconductor equipment sales
Pubblicato da Lorenzo Fontanelli. .
United States of America High-tech Export markets Global Economic Trends
After a tumultuous 2020, American exporters try to look ahead. As we approach mid-year, the US export community pins hope on 2021 for economic revival.
The latest ExportPlanning data on American foreign trade provides a useful first indication on future developments of sectoral exports. Moreover, they help to keep track of global investment demand. In particular, shipments of investment goods from the United States may serve as a gauge of how much willingness to invest businesses around the world actually retain. Investment goods, also known as capital goods, can be generally classified as follows: ICT and Service Equipment (F1), Industrial Tools and Equipment (F2), Machinery (F4) and Industrial Plants (F5).
The chart below displays the evolution of the different export categories from 2011 to 2020, taking 2011 as base year and assuming it to be equal to 100. At first look, machinery seems the main growth leader. Importantly, it is the only category whose sales did not slow down because of the pandemic. As mentioned in a previous article, US machinery exports performed remarkably well in 2020, reaching a value of $24 billion. This partially offsets the sharp drop recorded by ICT and service equipment (-9% YoY), industrial equipment (-12% YoY) and industrial plants (-13% YoY).
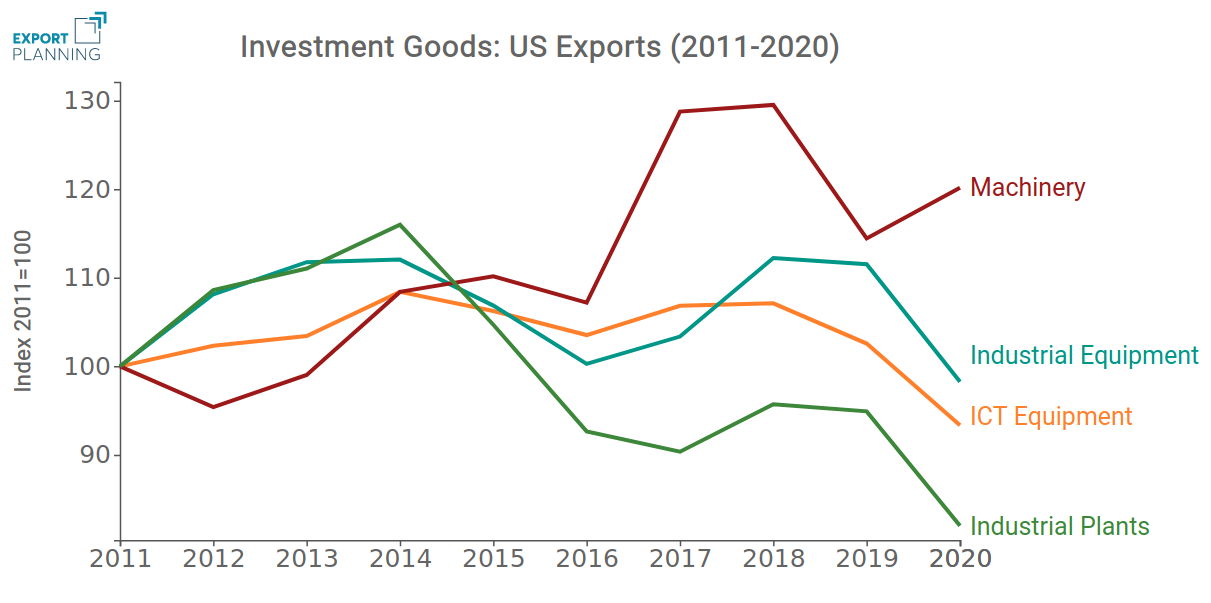
Source: ExportPlanning elaborations
To understand how global consumers actually value American products, we need to compare US exports with those flowing from the rest of the world. Since our focus is on capital goods, it might also be useful to find out whether they can be referred to as advanced technology products or not.
As illustrated in the chart, both hi-tech and non hi-tech exports are lagging behind other countries’ exports in 2021Q1.
Source: Export Planning elaborations
- Among non hi-tech goods, mention should be made of electromechanical tools (F2.19), whose foreign sales went up 5% in 2021Q1 (with respect to 2019Q1). In this category, grinders, sanders and planers signal a 45% YoY increase. Yet other products struggled to keep up with world levels: exports of boilers and furnaces (F2.18) and boilers, turbines and motors (F2.23) plunged respectively -26.8% and -23.8%.
- Differently from non hi-tech, hi-tech goods are quite relevant in terms of export values: as of 2019, exports of communication equipment (F1.42) and computer and peripheral equipment (F1.41) stayed well above $20 billion. In 2021Q1, sales of communication equipment grew 1.5% above corresponding 2019 values.
- Machines for the manufacture of semiconductors (F4.SEM) are by far the most successful products on global markets. Given the strategic opportunities, semiconductor machineries are a top US export.
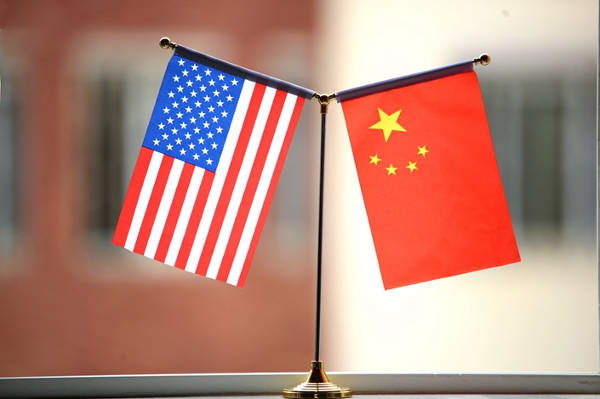
Machinery trade surges as increasing demand keeps the export boom alive. In 2020, China and South Korea have ranked first among US largest trading partners, with exports increasing respectively by 37% and 48% compared to 2019. Also Japan (+43% YoY) and Singapore (+24% YoY) remain favored destinations for US semiconductor equipments. 2021 has started on a particularly positive note for this kind of products, with sales abroad posting record quarterly value of $4.5 billion in the first quarter.
Another way to determine the relevance of US high-tech industry in global markets is market shares analysis. Despite a slowly-decreasing trend, the United States is the third largest player in hi-tech goods (after China and the Netherlands), holding a 7.5% market share.
The same can not be said of non hi-tech goods: for the segments the US (6.5%) slips significantly behind Germany (14%) and China (27%).
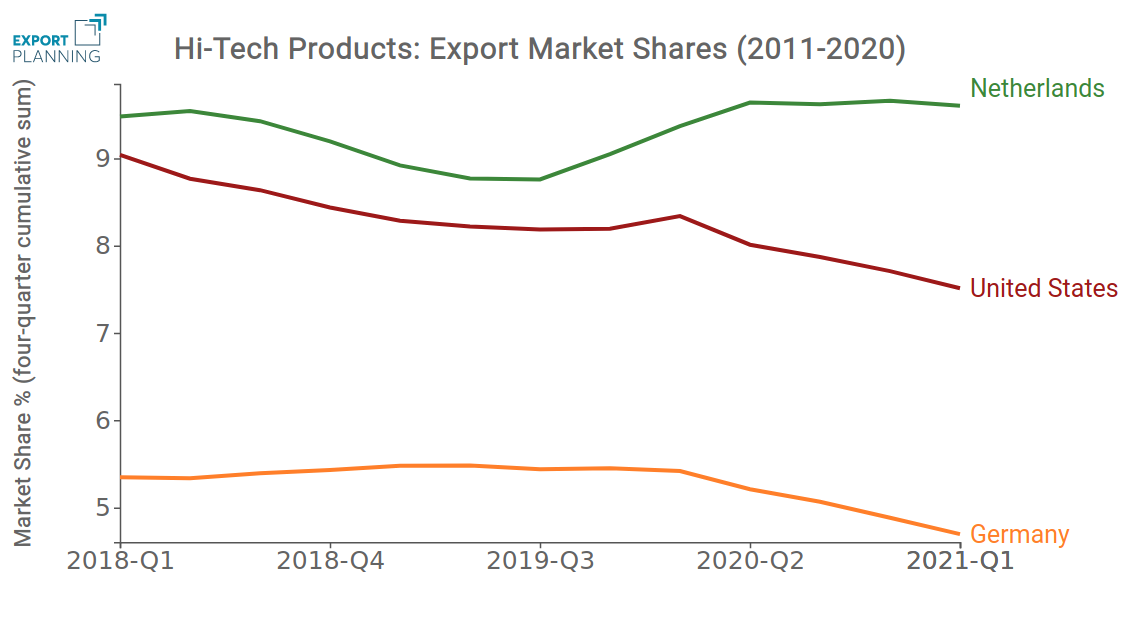
Source: ExportPlanning elaborations
Conclusions
This brief analysis has mapped the current state and recent developments in the US foreign trade of investment products. Driven by increasing demand for semiconductors, exports of machinery have grown significantly over this year’s first quarter. Such highly engineered systems are becoming more and more critical to several kinds of manufacturing worldwide. Global geopolitical instability, especially regarding trade policy, is forcing the U.S. industry to consider how to remain competitive in a world of unforeseen uncertainty and policy constraints. Partial recovery notwithstanding, hi-tech investment goods continues to be shipped in large quantities. The next quarterly data release will tell us more about the implications of this phenomenon.
Potrebbero interessarti anche:
US-China Phase One Deal: Tracking Progress H1-2021
Pubblicato da Gloria Zambelli. .
United States of America Slowdown Free trade agreements Asia Global Economic TrendsU.S. exports to China are not flourishing despite the commitment with the "Phase One" agreement [ leggi tutto ]

US Vehicles Components: an Update
Pubblicato da Gloria Zambelli. .
United States of America Importexport Electronics Automotive Global Economic TrendsEconomic recovery proceeds, although still marked by uncertainty [ leggi tutto ]

US Export Trends: Q2-2021 Figures
Pubblicato da Lorenzo Fontanelli. .
United States of America Macroeconomic analysis Importexport Global demand Global Economic TrendsExports during 2021-Q2 hit record high as they outpace pre-pandemic levels. Growing demand for American-made food and electronic parts [ leggi tutto ]