US-China Phase One Deal: Tracking Progress H1-2021
US exports to China are not flourishing despite the commitment with the "Phase One" agreement
Pubblicato da Gloria Zambelli. .
United States of America Slowdown Free trade agreements Asia Global Economic Trends
In the field of international trade 2020 year will be remember not only for the Covid-19 pandemic, but also for the beginning of “Phase One” agreement between the US and China.
Signed in January 2020, the deal aimed to create a truce in the trade dispute between Washington and Beijing.
A key part of the agreement includes the commitment from China to increase its imports of American products in 2020 and 2021, fixing growth targets based on trade flows in 2017. The purpose of Trump administration was in fact to impose a purchasing regime for Chinese companies in order to re-balance the trade deficit currently existing between the two countries.
Despite at the time of signature the expectation were high, as a matter of fact, the relation between the two Powers remain cold, and with the establishment of Biden administration, tensions have not diminished: in fact, during the last G7 in Cornwall, the US president tried to persuade European allies to consider China as a “Common Enemy”.
In this context, with only six months left by the term of the deal, an in-depth analysis is needed to find out whether, the ambitious targets can be met. Gathering data from ExportPlanning on US international trade, US exports to China of products belonging to the agreement can be estimated, checking whether targets are close to being accomplished. Covered products are clustered into three broad categories, namely Manufactured goods, Agriculture and Energy.
2020 Target: where were we?
As we reported in a previous article, none of the categories covered by the treaty lived up to the first year’s purchase objectives, whereas the country came close to fulfilling its agricultural exports. The 2020 targets established US exports growth to China- relative to 2017 baselines- of $12.5 billion in agricultural products, $18.5 billion in energy products, and $32.9 billion in Manufactured goods.
Clusters performances in 2020
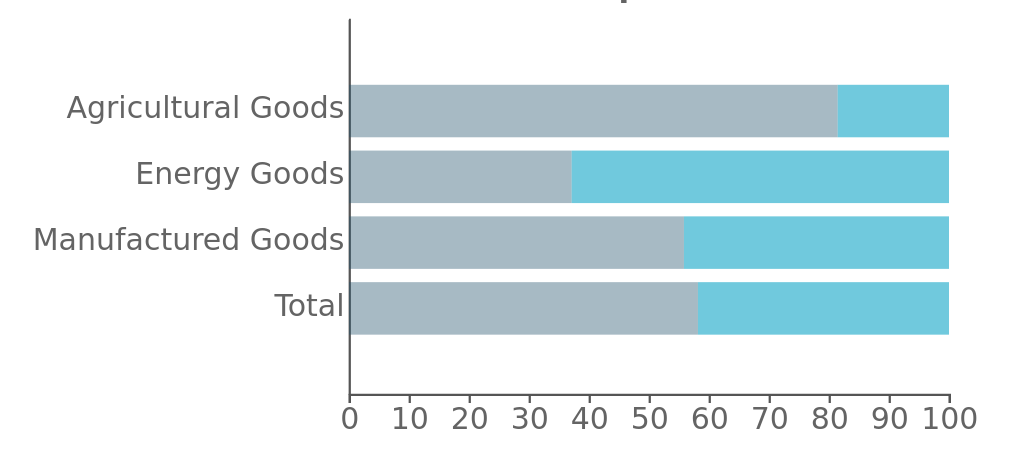
Late last year, total US exports to China accomplished only 58% of their 2020 target. Particularly negative was the performance of Manufactured and Energy Goods, which covered respectively only 56% and 37% of 2020 target. US agricultural products bucked the trend, fulfilling as much as 81% of the target.
Driving the growth of US agricultural goods exports to China was not only the general growth in consumption of agricultural products experienced during the pandemic year, but in particular for the strong Chinese demand for soybeans in order to recovering pig herd devastated by the spread of African swine fever (see A record year for US Soybeans).
Considering last year's debacle and that in the second year of the agreement, U.S. exports are expected to increase further, with six months to go before 2021, how are they doing this year?
2021 Targets: first semester checkpoint
As anticipated, the 2021 targets raise the stakes, providing an increase of at least $123 billion of American goods distributed as follows: an increase compared to 2017 import values of $44.8 billion for Manufactured goods, an increase of $19.5 billion for Agrifood products, a growth of $33.2 billion for Oil&Gas over the 2021.
In order to get a a comprehensive picture of the current results of the agreement the graph below illustrates the development of US Agricultural, Manufacturing and Energy exports to China.
US Exports to China (2011-H1 to 2021-H1)
Index 2017-H1=100

As you may observe, for Manufactured goods stagnation prevail, with a weak upturn of approximately $25 billion. Data on the Energy and Agricultural sectors show an improving dynamic and it is possible to expect a recovery in exports in the second half of the year. However, as things stand, it is likely that the targets will not be met for 2021 either, considering that none of the three clusters has fulfilled more than 35% of goals.
Manufactured goods: US Pharmaceutical exports booming
In conclusion, in light of the relevance of Manufacturing exports in the trade deal, it can be useful take a closer look at the export performance of the specific industries involved. In the following graph the different industries are placed according to the rate of change in exports in 2020 over 2017 (on X-axis) and rate of change recorded in H1-2021 compared to the first semester 2017 (on Y-axis). While, the size of each ball is proportional to 2017 exports value.
Manufactured Goods - US exports to China
Overall, the picture of US manufacturing industries exports is highly heterogeneous. In H1-2021, almost all industries showed a weak positive performance compared to the 2020 results, placing them nearby or above the yellow bisector, which separated the declining from the accelerating industries. In line with the worldwide change in consumption preferences due to the outbreak of pandemic crisis, particularly positive is the performance of US Pharmaceutical Products, which opened the first half of 2021 with an almost 122% growth rate compared to the value of H1-2017, proving to be the best dynamics industry during the opening semester. In contrast, the most significant downturns are visible in Aircraft, Iron and Steel and Vehicle (-79%, -63% and -40% over H1-2019), despite a slight recovery. In H1-2021, the total manufacturing exports, however, only reached 29% of the phase one annual target, far below the expectations.
Potrebbero interessarti anche:

US Vehicles Components: an Update
Pubblicato da Gloria Zambelli. .
United States of America Importexport Electronics Automotive Global Economic TrendsEconomic recovery proceeds, although still marked by uncertainty [ leggi tutto ]

US Export Trends: Q2-2021 Figures
Pubblicato da Lorenzo Fontanelli. .
United States of America Macroeconomic analysis Importexport Global demand Global Economic TrendsExports during 2021-Q2 hit record high as they outpace pre-pandemic levels. Growing demand for American-made food and electronic parts [ leggi tutto ]

An Overview Of The US Aircraft Parts Industry
Pubblicato da Lorenzo Fontanelli. .
United States of America Export markets Foreign Market AnalysisIn 2021-Q1, exports of California and Connecticut have returned to pre-crisis levels, while North Carolina still lags behind [ leggi tutto ]