High-tech sectors are driving global trade in the first nine months of 2025.
Published by Marzia Moccia. .
Conjuncture Global demand Industries Uncertainty High-tech Global economic trendsThe availability of ExportPlanning’s foreign trade data updated to Q3 2025 makes it possible to highlight how, in the cumulative total for the first nine months of 2025, the US market represented a supporting factor for the growth of global trade in goods. However, this result appears to be entirely attributable to the exceptional phase of “front-loading purchases” by the United States during the first quarter of the year, a dynamic that was later followed by a gradual normalization. Starting from the second quarter, in fact, US imports in volume terms — therefore net of price and exchange rate variations — essentially halted their expansion.
Although American demand therefore acted as a support to global trade growth in 2025, it is equally relevant to note that even net of this contribution, international trade in goods continues to show an expansionary pace. Overall, ExportPlanning’s preliminary estimates indicate for the January–September 2025 period a year-over-year growth in global demand for goods of 4.6%, a figure that drops to 3.8% when excluding the demand component attributable to the US market.
In this context, the sectoral breakdown of global demand net of the US component assumes particular importance, as it allows us to assess the health of the main industries contributing to international trade in goods.
The trade map by industry: global demand excluding the US
The chart below represents the main industries involved in international trade in goods, positioned according to the import growth rates recorded in 2024 (X-axis) and in the period January–September 2025 (Y-axis). Import flows are expressed at constant prices, in order to provide an analysis of real trade dynamics.
The bisector (shown in yellow) serves as a key interpretative reference: industries positioned along the bisector show a pace of growth broadly in line with that of 2024, while those below the line show a slowdown in the expansionary dynamic; those above the line, on the other hand, indicate an acceleration of growth.
The size of each ball is proportional to the total trade volume of that industry.
Fig.1 - Global demand map by industry at constant prices
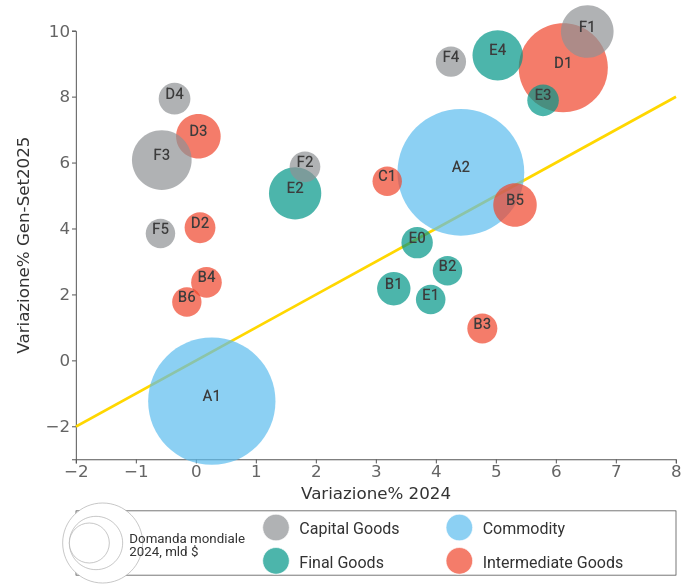
Source: ExportPlanning elaborations
The particularly interesting aspect lies in the fact that it is possible to clearly identify some industry clusters in relation to their pace of development.
Industries driving growth
In this group we find the industries located at the top right of the chart: these are segments that have experienced a strengthening of real growth compared to last year. For Investment Goods, we especially find:
- ICT Equipment (F1) and the related electronic components supply chain (D1): growth is closely linked to the rising global demand for CPUs, processing units and processors, a phenomenon that reflects the spread of Artificial Intelligence technologies and the consequent expansion of global digital infrastructure;
- Machinery (F4): in line with the positive trajectory of ICT products, strong increases can be observed in demand for Semiconductor manufacturing machines, accompanied by widespread growth across all major segments of the industry. Standing out in particular are double-digit increases for Extrusion machines, Textile machinery and Metalworking machines, signaling broad-based strengthening in demand for capital goods.
On the Consumer Goods front, the following sectors stand out:
- Healthcare System (E4), with particularly dynamic increases for Pharmaceuticals and Medical-electrical equipment;
- Home System (E3), driven in particular by trade in Home appliances and Consumer electronics.
Industries consistent with 2024
In this group we find industries showing a pace of expansion broadly in line with last year, essentially “aligned” along the bisector: in addition to Raw Materials (A), this cluster includes Fresh Agri-food (B1) and Processed Agri-food (E0) as well as Chemical Intermediate Goods (B5).
Industries rebounding
In the upper left quadrant are industries showing a rebound compared to 2024 dynamics. This group is particularly populated by Investment Goods, with significant recovery signals across several segments:
- Automotive Supply Chain (D3–F3): the rebound is driven in part by the Motor vehicles segment, in particular hybrid cars (especially plug-in hybrids) and electric vehicles, along with related battery and accumulator components. More dynamic performances are observed in Earth-moving machinery, Motorcycles and Agricultural machinery;
- Electrotechnical industry (D4): the recovery is driven by Electric motors, generators and transformers, in line with growing demand for electrification-related technologies;
- Industrial plant engineering (F5): strong growth momentum is observed, concentrated in Chemical plants and Mineral processing plants, sectors benefiting from rising demand for refined raw materials.
Conclusions
The analysis of foreign trade data for the first nine months of 2025 confirms that global demand — net of the US market component — is driven by high-tech supply chains, particularly those linked to ICT, semiconductors and advanced machinery. This dynamic reflects growth in demand along the entire value chain.
Overall, signals strengthen of a moderately expansionary phase for Investment Goods, characterized by the strengthening of development trends both for industries leading electrification and the green transition and for traditional segments. The most interesting aspect is the broad diffusion of this trend, spanning across multiple macro-sectors, supported also by the easing of restrictive monetary policies on a global scale.
These signals suggest a structural evolution pattern for global trade in the coming years, where segments with high technological and green content gain in importance.
Monitoring international market trends is one of ExportPlanning’s areas of specialization, thanks to its extensive Information System that includes over 5,500 customs tariffs and more than 150 geographies. In an uncertain and changing global scenario, to explore the performance of specific markets and products, Market Insights was created.
You may be interested in:

Healthcare Industry: Robust Growth in international trade confirmed in 2025
Published by Marcello Antonioni. .
Health products Conjuncture Export Global economic trendsWorld exports of the healthcare industry have been growing strongly, across almost all sectors, but with differences between competing countries [ Read all ]

Electrical Engineering: one of the fastest-growing industrie in international trade 2025
Published by Marcello Antonioni. .
Electronics Conjuncture Export Global economic trendsWorld exports of Electrical Engineering are growing robustly, across almost all sectors, but with differences between competitor countries [ Read all ]

US Tariffs: Even More Uncertainty?
Published by Marzia Moccia. .
United States of America Uncertainty Trade war Global economic trends“Tariff is the most beautiful word in the dictionary”, stated Donald Trump during his second campaign for the White House, clearly foreshadowing the central role that tariffs would play in shaping t}... [ Read all ]