Steel and Aluminum Tariffs Increased: Which U.S. States Are Most Exposed?
Published by Simone Zambelli. .
Uncertainty Trade war American States Market Accessibility
The steel and aluminum sectors remain among the most closely watched areas by the Trump administration.
Tariffs on these products were initially introduced in 2018—during Trump's first term—but were then suspended in 2021 for the European Union, following the renewed transatlantic dialogue under the Biden administration.
However, already in February, the new Trump administration reinstated additional 25% duties on both sectors, culminating in the latest announcement of a 50% rate starting from June 4, 2025.
To justify the latest decision to increase the additional tariff rate, the U.S. President declared the need to provide greater support to domestic industries, in order to eliminate the threat to National Security documented by the findings of the 2018 investigation. But what information can we derive from the analysis of U.S. import flows of the tariffed products?
The chart below shows the historical series of U.S. imports of steel and aluminum.
Fig. 1 – U.S. Imports of Steel and Aluminum
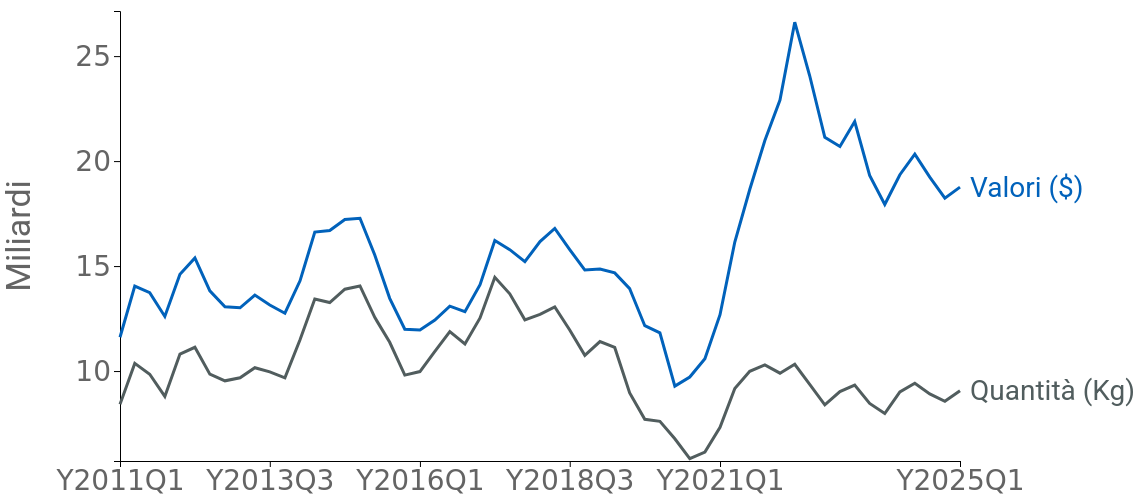
Source: ExportPlanning
The chart reveals a particularly interesting insight: the trend of U.S. demand for imported steel and aluminum presents very different results when considered in nominal values versus quantities (Kg).
Following the first tariff action in 2018, a drop was recorded both in value and in quantity for imports in the two sectors. From 2021 onwards, however, a rise in values is evident, also supported by the significant increase in raw material prices.
In terms of quantity, in fact, the partial rebound in imports seen since 2021—also supported by bilateral agreements promoted by the Biden administration—has been significantly weaker, and overall, steel and aluminum imports have never again reached pre-2018 levels. This data appears to contradict the Trump administration's decision to further increase the rates up to 50%, suggesting that the current level of imports may not justify such a severe measure.
A focus by U.S. States
A second factor worth analyzing relates to the significant differences among U.S. states, thanks to the availability in the ExportPlanning Information System of segmented import data by state.
The following table shows the top ten U.S. states that, in 2024, imported the highest quantities of steel and aluminum from European Union countries, making them the most exposed to the tariff increase that also involves the EU.
The 2024 values are compared with those from 2017, and for each state, the variation (delta) is calculated as the difference between the two years.
Tab. 1 – Top U.S. States by Imports of Steel and Aluminum from the EU
| U.S. State | 2017 Value ($ million) |
2024 Value ($ million) |
Delta 2024–2017 ($ million) |
|---|---|---|---|
| Texas | 1428 | 2076 | 648 |
| Illinois | 753 | 769 | 16 |
| Michigan | 661 | 752 | 91 |
| South Carolina | 427 | 703 | 276 |
| Ohio | 512 | 634 | 122 |
| New Jersey | 747 | 589 | -158 |
| Alabama | 418 | 433 | 15 |
| Pennsylvania | 400 | 409 | 9 |
| Indiana | 265 | 370 | 105 |
| Louisiana | 121 | 336 | 215 |
Naturally, the industrial regions of the United States are responsible for the majority of steel and aluminum imports, given the importance of manufacturing in these states. Secondly, the delta between 2024 and 2017 values appears positive for nearly all states, reflecting the divergence between the dynamics of import values and quantities outlined in the first part of the analysis.
Texas stands out as by far the leading U.S. state in steel and aluminum imports from the European Union, with a value exceeding 2 billion dollars in 2024. It is also the state that recorded the largest absolute growth since 2017 (650 million dollars).
In second place is Illinois, with imports of about 770 million dollars; however, this value has remained largely stable over time. Michigan and South Carolina also show significant import levels, with a steady growth trend in recent years.
New Jersey is the only one among the top ten states to record a negative delta: compared to 2017, it has dropped several places in the ranking, falling from third to a less prominent sixth position.
Conclusions
The Trump administration’s tariff hike marks a return to protectionist trade policies already tested in 2018. However, the most recent data show that, in terms of quantity, steel and aluminum imports have never returned to pre-tariff levels, raising questions about the effectiveness of a further rate increase to 50%.
The heterogeneous picture across U.S. states suggests that the economic consequences of the new tariffs will be unevenly distributed across the country, hitting states like Texas the hardest.
In light of this, the measure seems more like a political signaling choice than a response to a real surge in imports, and risks fueling new trade tensions with the European Union at a time when transatlantic relations need to regain dialogue.
With the ExportPlanning Information System, it is possible to:- stay constantly updated on the tariffs in force for EU exporters to the U.S. market across all 5,500 Harmonized System codes;
- segment U.S. imports at the individual state level

You may be interested in:

US Tariffs: Even More Uncertainty?
Published by Marzia Moccia. .
United States of America Uncertainty Trade war Global economic trends“Tariff is the most beautiful word in the dictionary”, stated Donald Trump during his second campaign for the White House, clearly foreshadowing the central role that tariffs would play in shaping t}... [ Read all ]

From Sales Attempts to Strategic Planning: The Role of Geopolitics in Shaping Firms’ Internationalization Decisions
Published by Marzia Moccia. .
Planning Conjuncture Foreign markets Uncertainty International marketing International marketingRecent developments have made it increasingly clear that the international environment is characterized by a growing and persistent level of uncertainty and geopolitical instability, directly affecti}... [ Read all ]

World Trade in Capital Goods: Preliminary Results for 2025 and Forecasts for 2026-2029
Published by Marcello Antonioni. .
Metal industry Global demand Forecast Uncertainty International marketingAfter a positive performance in 2025, a widespread deterioration is expected for next year [ Read all ]