The new ExportPlanning global trade business cycle indicator
Published by Simone Zambelli. .
Conjuncture Global demand Foreign markets Uncertainty Global economic trendsIn recent months, uncertainty in the international landscape has increased rapidly, with a significant acceleration in the area of trade policy. The return of the Trump administration and the adoption of protectionist measures, culminating in the announcement of generalized tariffs on April 2, have triggered an unprecedented surge in trade uncertainty. This has become a key factor influencing global economic growth prospects and international trade flows.
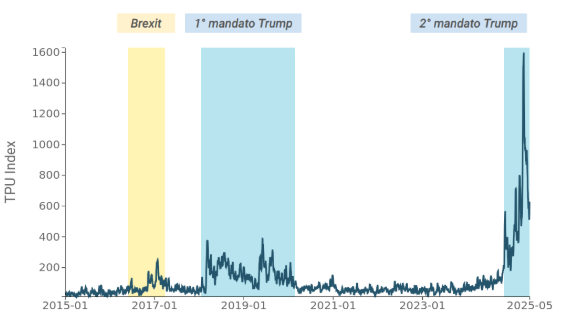
As shown in the chart below, following the so-called "Liberation Day," the Trade Policy Uncertainty Index reached record levels, nearly four times higher than those recorded during Trump’s first presidency. The index has since shown a relative decline but remains at historically high levels.
Fig.1: Trade Policy Uncertainty Index
(daily moving average, last observation: May 31)
Companies are therefore operating in a context of significant uncertainty, which hampers strategic planning and affects investment and growth prospects. In this scenario, having real-time monitoring of available information and sector-specific demand conditions becomes increasingly essential in order to support timely and informed decisions.
The new ExportPlanning Global Trade Indicator was developed in response to this need, designed to provide companies with an analytical tool that is continuously updated to support commercial strategy.
The Global Trade Indicator: construction and key features
The indicator is based on a representative sample of countries covering about 60% of global demand, including the European Union, the United States, China, Japan, and South Korea.
Trade data come from reliable sources:
- Eurostat for European countries,
- the Census Bureau for the United States,
- and national customs offices for the remaining countries.
The timeliness of the data sources allows for updates up to April 2025 with the June release.
The data also feature detailed product segmentation, down to the 6-digit Harmonized System (HS) code, enabling analysis at the individual product level. Aggregates are also constructed according to the ExportPlanning classification, allowing access to sectoral and overall indicators.
Analysis and comparisons
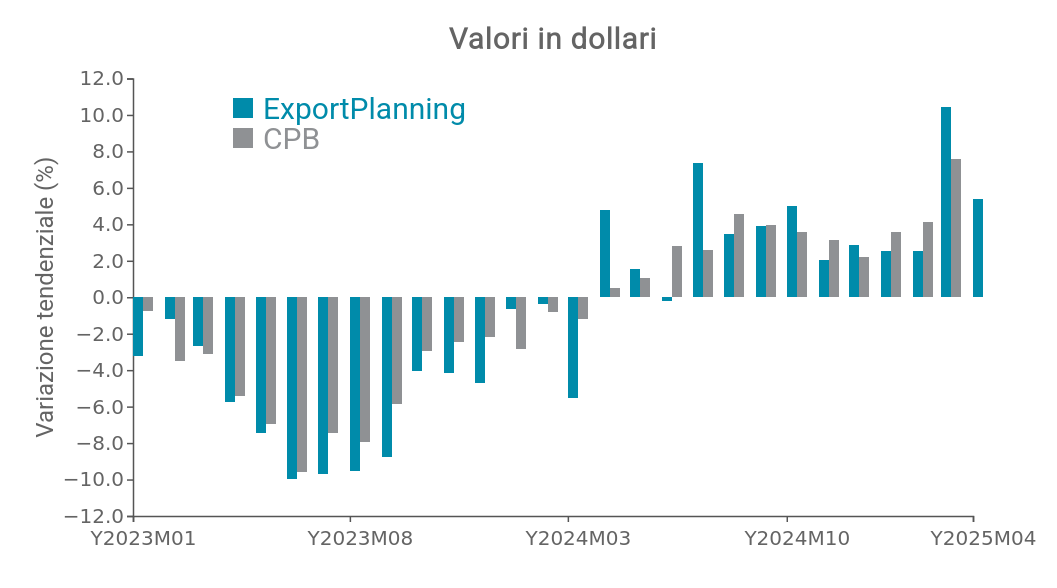
The two charts show the year-on-year trends of the Global Trade Indicator developed by ExportPlanning, compared with data from CPB (Central Planning Bureau). The variations are expressed in year-over-year percentage terms.
The first chart presents changes at current prices, or in nominal terms. After a prolonged downturn in 2023, largely due to inflationary pressures and a slowdown in global demand, a trend reversal is seen during 2024, which intensifies in the early months of 2025, also thanks to the large movement of goods that preceded Trump’s tariff measures.
The second chart instead shows changes at constant prices, i.e., net of inflation. Here the trend appears more stable and less volatile: the 2023 contraction is less severe, while the 2024 recovery, although present, is more gradual. Constant-price data provide a more realistic picture of the physical volume of trade, showing that global commerce is regaining momentum, though at a more moderate pace.
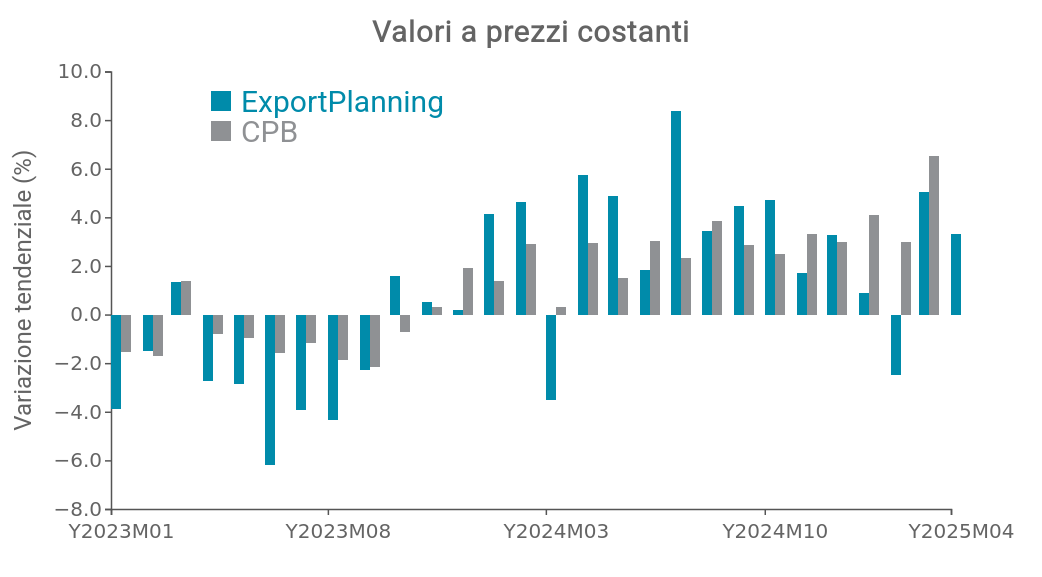
This dual perspective—nominal and real—makes it possible to distinguish between price effects and the actual growth of trade flows, offering a more complete picture of the evolution of global trade over the 2023–2025 period.
Conclusions
In a scenario where trade policy is marked by ongoing uncertainty, having up-to-date and reliable data is crucial for companies needing to make strategic decisions.
The ExportPlanning Global Trade Indicator meets this need by providing monthly monitoring of global demand at the HS6 product code level. The tool serves as a solid analytical support for assessing foreign markets and managing trade risk in a volatile macroeconomic environment.
You may be interested in:

Healthcare Industry: Robust Growth in international trade confirmed in 2025
Published by Marcello Antonioni. .
Health products Conjuncture Export Global economic trendsWorld exports of the healthcare industry have been growing strongly, across almost all sectors, but with differences between competing countries [ Read all ]

Electrical Engineering: one of the fastest-growing industrie in international trade 2025
Published by Marcello Antonioni. .
Electronics Conjuncture Export Global economic trendsWorld exports of Electrical Engineering are growing robustly, across almost all sectors, but with differences between competitor countries [ Read all ]

US Tariffs: Even More Uncertainty?
Published by Marzia Moccia. .
United States of America Uncertainty Trade war Global economic trends“Tariff is the most beautiful word in the dictionary”, stated Donald Trump during his second campaign for the White House, clearly foreshadowing the central role that tariffs would play in shaping t}... [ Read all ]