Food & Beverage World Trade in 2023: premium-price sales shine
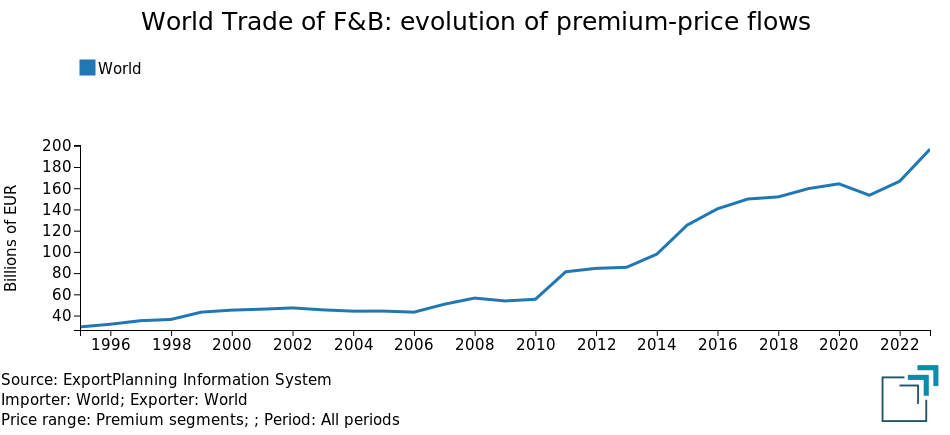
At the end of the year, an increase of just 3 percent in euros is expected in overall flows; by over 18 percent with reference to flows in the highest price ranges
Published by Marcello Antonioni. .
Premium price Food&Beverage Conjuncture Uncertainty International marketingBased on the 2023 preliminary final data from ExportPlanning, the world trade of packaged food and beverages1 (hereinafter also referred to as "Food & Beverage" [F&B]) is expected to close the year with a moderate increase in euro values compared to 2022 (+3.1%), but - if measured at constant prices (therefore excluding inflation and currency phenomena)2 - down by around 2 points and half percentages.
This is, therefore, a performance of significant slowdown compared to the experience of the previous two-year period (2021-2022), when the values in euro had grown by more than 16% on average per year and quantities by almost 5 percentage points per year.
In a context of slowdown in global F&B trade, the premium-price segments have been able to remain particularly dynamic...
.. in the face of a significant reduction
in sales in the lower price ranges.
The slowdown in global trade in F&B products has particularly suffered this year from the sales of the lowest quality/price ranges, which - based on the pre-estimates formulated by StudiaBo in within the ExportPlanning Information System - 2023 is expected to close with a decrease of over 13 percentage points in euro values (and of almost 15 points % in measurement at constant prices).
Indeed, these are the market segments that are relatively more exposed to the high cost of living associated with the rise of inflation in the main Western economies and which - as has happened in other consumer goods industries, such as those of the Fashion4 and Home Products5 industries - has seen a stronger than average downsizing of these segments, especially in comparison to the higher price ranges (in a positive systematic countertrend in the consumer goods industries considered).
World Trade of Packaged Food and Beverage by price ranges
(shares at current prices)
| 2019 | 2020 | 2021 | 2022 | 2023E | |
| High/Medium-High price ranges | 30.3% | 31.6% | 26.9% | 24.0% | 27.8% |
|---|---|---|---|---|---|
| Medium price range | 36.1% | 36.3% | 37.0% | 39.2% | 40.9% |
| Low/Medium-Low price ranges | 33.5% | 32.1% | 36.1% | 36.8% | 31.3% |
| TOTAL | 100.0% | 100.0% | 100.0% | 100.0% | 100.0% |
Source: ExportPlanning - Data - Annual Trade Data, Ulisse Datamart
The significant and widespread growth in 2023 of Premium-Price flows
Similarly to the cases of the Fashion and Home systems, in 2023 global sales of the premium-price ranges also showed significant increases in the Food&Beverage industry. According to the estimates formulated by StudiaBo based on the first 10 months of the year, in 2023 trade flows of high and medium-high price ranges of packaged food and beverages are expected to record a growth of more than 18 percentage points in euro values (+15.6% at constant prices).
The increase in 2023 global sales of the high and medium-high price range was evident in all the main sectors of the Food & Beverage industry
The increase in global "premium-price" flows in 2023 characterized all the main sectors of the Food&Beverage industry, as evidenced by the table below.
Food&Beverage: premium-price world trade evolution by sectors
| Delta 2023E/2022 | Change 2023E/2022 | |
| (Bn euro) | (% in euro) | |
| Meat and fish (processed and packaged) | +5 999 | +11.6 |
|---|---|---|
| Water and soft drinks | +4 783 | +32.2 |
| Vegetables&fruit (processed and packed) | +4 635 | +35.4 |
| Cookies and other bakery goods | +4 081 | +32.4 |
| Rice, pasta and flour (packaged) | +3 914 | +104.2 |
| Tea and coffee (packaged) | +2 034 | +26.7 |
| Oil, condiments and spices | +1 932 | +47.4 |
| Milk, yoghurt, butter and cheese | +1 452 | +11.2 |
| Sugar, chocolate, sweets and ice cream | + 992 | +10.4 |
| Alcoholic beverages | + 431 | + 1.2 |
| TOTAL | +30 252 | +18.2 |
Source: ExportPlanning - Data - Annual Trade Data, Ulisse Datamart
All sectors (with the exception of alcoholic beverages) have, in fact, highlighted growth in "premium-price" sales estimated at double digits percentages in euro values.
In particular, it should be highlighted the increases in global sales of high and medium-high price ranges for packaged rice, pasta and flour (+104 percent, equal to almost 4 billion euros), oil, condiments and spices (+47.4%, for a value of almost 2 billion euros), vegetables and fruit, processed and packaged (+35.4%, equal to over 4.6 billion euros ), biscuits and other bakery goods (+32.4%, equal to approximately 4.1 billion euros), water and soft drinks (+32.2%, for a value of almost 4.8 billion euros), packaged tea and coffee (+26.7%), as well as - for the greatest absolute increases - the performance of meat and fish, processed and packaged (+6 billion euros).
Conclusions
As already documented for other consumer goods (Fashion and Home Products) industries, the weakening of global demand for Food & Beverage products during 2023 has seen differentiated patterns in consumer choices, with a strong reduction in the lower price ranges (more exposed to the effects of the high inflation experienced in the main world markets), to the advantage - instead - of sales in the highest ranges.
This phenomenon has affected, in a transversal manner, all the main sectors of the Food & Beverage industry, with increases in sales of the "premium-price" segments estimated at double-digit percentages in euro values for almost all the sectors considered.
It is therefore a significant and sector-wide phenomenon, which has certainly determined a environment favorable to the adoption of qualitative differentiation strategies by companies in this industry operating on international markets.
1) For a description of the sectors included in the aggregate considered, please refer to the relevant industry profile.
2) The measure Quantities at constant prices (Q). This measure includes a deflation operation, in which the historical series of monetary values (V) has been transformed into an analogous series of values expressed at constant prices, with a reference to a given year, known as the base year. For a description of the methodology applied, please refer to Methodological Note (page 13).
3) In the Annual Trade Data database of the ExportPlanning Information System, in the case of differentiable products, the trade flows of each product were broken down into quality/price ranges based on the distribution of prices at a global level. For a description of the methodology applied, please refer to the related Methodological Note (pages 11-12).
4) See the article "Pre-final figures for 2023: world trade of the Fashion industry declining, but with differentiated performances in terms of price ranges".
5) See the article "Home Products: world trade declining in 2023, but not in the premium segments".
You may be interested in:
Global trade in footwear machinery: China dominates, Italy leads the way in premium technology
Published by Mauro Badanelli. .
Industrial equipment Conjuncture Foreign markets International marketingThe footwear machinery industry represents one of the pillars of manufacturing innovation in the fashion sector. In an increasingly competitive environment, characterized by global markets, growing }... [ Read all ]

World Trade Trends: International Trade Results in Q2 2026 (Preliminary Estimates)
Published by Marcello Antonioni. .
Home items Fashion Food&Beverage Metal industry Intermediate goods Electronics Chemicals Industrial equipment Conjuncture Automotive Global demand Industries Global economic trendsStrengthening dynamics, driven by AI applications, and the green and digital transitions [ Read all ]

IMF WEO Update July 2026: a (precarious) balance between war and technology
Published by Alba Di Rosa. .
Macroeconomic analysis Asia Emerging markets United States of America Uncertainty IMF Eurozone Global economic trendsPer il 2026 il Fondo ha rivisto lievemente al ribasso le stime di crescita del PIL mondiale, ora previsto al +3% [ Read all ]