Are Trump’s tariffs really reshaping EU exports?
A sector-by-sector look at the state of US-EU trade
Published by Simone Zambelli. .
Europe United States of America Export Economic policy Foreign market analysis
The return of the Trump administration to the White House marks a turning point in international economic dynamics, introducing elements of discontinuity compared to the multilateral and cooperative approach that, albeit with alternating phases, had characterized U.S. trade policy in recent decades. This shift is also clearly reflected in transatlantic relations between the United States and the European Union, traditionally considered one of the pillars of the global economic order.
In this context, one of the most debated issues naturally concerns the strong protectionist turn of American trade policy and its effects on the performance of European exports to the U.S. market over recent months.
The analysis of recent trade flows, supported by the availability of data for the third quarter of 2025 within the ExportPlanning Information System, plays a crucial role in understanding the effectiveness of U.S. tariffs and their impact on European exports.
The following table provides a breakdown of EU exports to the United States by main product clusters, linking each category to the currently applied tariff rate (and related changes recorded during the year).
For each cluster, the table also reports the overall change observed in the first nine months of the year and the change recorded after the introduction of tariffs; the variation is measured at constant prices to capture the real effects net of exchange rate fluctuations.
The proposed representation allows a quick visual assessment of the effects of U.S. tariffs on the dynamics of European exports.
Tab.1 – EU Exports to the USA
(% changes at constant prices)
| Products | % Share of total EU exports | Change first 9 months 2025 | Change after tariff introduction | Rates |
|---|---|---|---|---|
| Exempt (e.g.: Pharma, semiconductors, etc.) |
37.7 | 33.7 | - | 0% |
| Automotive | 6.0 | -18.8 | -30.2 | 25% April → 15% August |
| Automotive components | 5.4 | -1.3 | -2.9 | 25% April → 15% August |
| Industrial raw materials (Steel, aluminum, copper and derivatives) |
19.3 | 5.6 | 7.2 | Quotas → 25% March → 50% June |
| Other (e.g.: Agri-food, Fashion and Home systems, etc.) |
31.6 | 0.7 | -1 | 10% April → 15% August |
Firstly, several types of tariffs apply to European exports: sectoral tariffs affecting specific product segments (e.g. Automotive and Industrial Raw Materials) and “reciprocal” tariffs resulting from the trade agreement signed in Scotland and effective since August 1. In addition, certain categories of products remain exempt.
Naturally, Exempt products show the strongest growth: in the first nine months of 2025 they increased by about 33.7% compared to the same period in 2024. This group, which accounts for the largest share of EU exports to the United States (over 37%), continues to benefit from full trade freedom, with the pharmaceutical sector leading the way.
The situation is completely different for the Automotive sector, which is among the most heavily penalized clusters. Exports of finished vehicles suffered a sharp contraction of -18.8% for the whole of 2025, worsening to -30.2% in the months following the introduction of tariffs (May–September). The Automotive components supply chain also declined, though to a much lesser extent: -1.3% in 2025 and -2.9% after the tariffs came into force.
However, this decline cannot be attributed solely to protectionist measures: the automotive sector is suffering from weak global conditions and stagnant demand, as also shown by the continued decline in U.S. car registrations during 2025, worsening an already downward trend.
Fig.1 - Monthly U.S. Vehicle Registrations
(year-on-year growth rate)
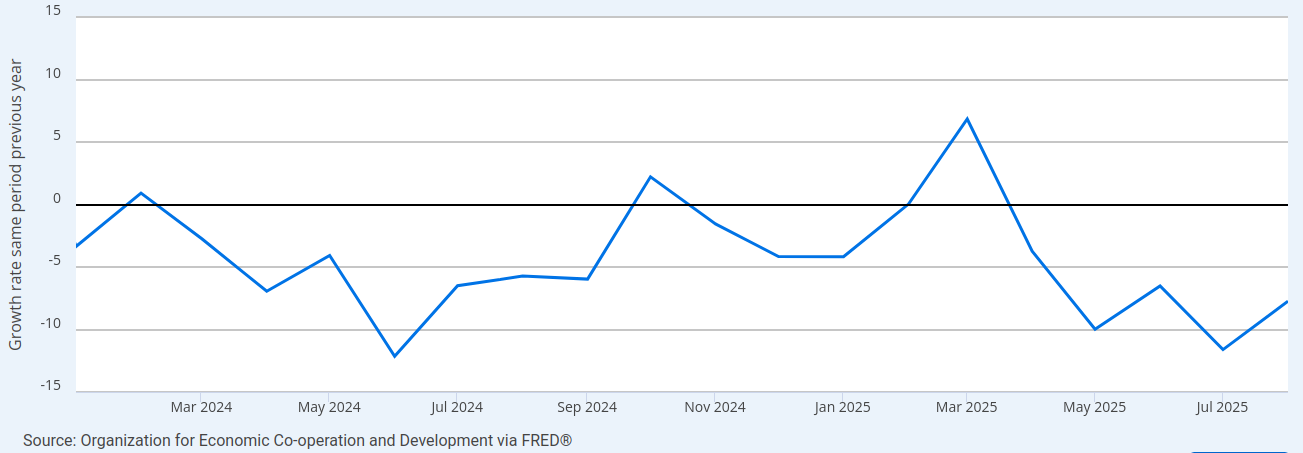
Source: FRED
The Industrial raw materials sector (steel, aluminum, copper, and derivatives) remains more resilient. Despite tariff increases imposed by the second Trump administration—rising first to 25% in April and then to 50% in June 2025—European exports grew by 5.6% in the first nine months and by 7.2% after the new rates came into effect.
Following the first wave of tariffs introduced in 2018 by the previous Trump administration, a Tariff Rate Quota (TRQ) regime was implemented in 2021 for the EU, allowing zero or low tariffs within a set import quota and higher tariffs beyond that limit. The tariff tightening decided by the second Trump administration in 2025 does not seem to have had particularly negative effects on European exports in this sector, which have continued to grow despite higher rates. This trend likely reflects the greater preparedness of European firms operating in this field, already accustomed to dealing with complex customs procedures.
Finally, the “Other” category, representing nearly one-third of EU exports to the United States, shows very limited and overall stable variations. This heterogeneous aggregate, characterized by different tariff levels across countries, is influenced by opposing forces. The European Union benefits from one of the lowest tariff rates (15%) among major international competitors, which enhances its competitiveness; however, competition mainly occurs with U.S. domestic producers, while American demand for imported goods remains relatively inelastic. The case of the wood-furniture sector, well documented in the article US tariffs and wooden furniture: how relative prices and consumer choices are changing, is an emblematic example of these sectoral dynamics.
Overall, therefore, the impact on most iconic European products exported to the U.S. market appears very limited.
When converting the same flows into euros, the overall picture remains essentially unchanged. Exempt products show an increase of around 31.8%, while the automotive sector and its components record even sharper declines, around -20.8% and -2.6% respectively in 2025, with the downturn intensifying after the introduction of tariffs. Industrial raw materials such as steel, aluminum, and copper continue to post positive changes even at current prices, though smaller in magnitude, while the “Other” category shows a slight decline. In summary, the marked depreciation of the dollar against the euro observed since the beginning of the year, although affecting nominal trade values, does not alter the overall picture: the impact of protectionist measures remains moderate.
Tab.2 – EU Exports to the USA
(% changes at current prices in euros)
| Products | % Share of total EU exports | Change first 9 months 2025 | Change after tariff introduction | Rates |
|---|---|---|---|---|
| Exempt (e.g.: Pharma, semiconductors, etc.) |
37.7 | 31.8 | - | 0% |
| Automotive | 6.0 | -20.8 | -35.3 | 25% April → 15% August |
| Automotive components | 5.4 | -2.6 | -6.4 | 25% April → 15% August |
| Industrial raw materials (Steel, aluminum, copper and derivatives) |
19.3 | 2.2 | 2.1 | Quotas → 25% March → 50% June |
| Other (e.g.: Agri-food, Fashion and Home systems, etc.) |
31.6 | -1.5 | -5.4 | 10% April → 15% August |
Conclusions
In summary, the impact of the new tariffs introduced by the Trump administration appears, at least in the short term, overall limited compared to the declared objectives. Although the European automotive sector shows signs of slowdown, this trend does not translate into a significant competitive advantage for U.S. industry, which continues to face moderate domestic demand and limited capacity to substitute imports. Similarly, in strategic sectors such as industrial metals, the United States remains highly dependent on foreign supplies, showing that tariff policy is not generating a tangible increase in production self-sufficiency.
In conclusion, protectionist measures highlight the challenges of adapting an economy deeply integrated into global value chains to a protectionist framework. On this topic, see the article Trump 2.0: How Effective Is U.S. Tariff Policy?.
You may be interested in:

B-READY 2025: the World Bank’s new compass for economic development
Published by Veronica Campostrini. .
Macroeconomic analysis Foreign markets Economic policy Central banks Foreign market analysisWith the publication of the Business Ready 2025 report, the World Bank introduces the new B-READY (Business Ready) index, intended to permanently replace the previous Doing Business, which was suspend}... [ Read all ]

Healthcare Industry: Robust Growth in international trade confirmed in 2025
Published by Marcello Antonioni. .
Health products Conjuncture Export Global economic trendsWorld exports of the healthcare industry have been growing strongly, across almost all sectors, but with differences between competing countries [ Read all ]

Electrical Engineering: one of the fastest-growing industrie in international trade 2025
Published by Marcello Antonioni. .
Electronics Conjuncture Export Global economic trendsWorld exports of Electrical Engineering are growing robustly, across almost all sectors, but with differences between competitor countries [ Read all ]