Between uncertainty and diversification: the map of demand in the first nine months of 2025
Published by Marzia Moccia. .
Conjuncture Global demand Global economic trends
In an increasingly complex international environment, the multilateral cooperation system is undergoing a deep restructuring, accelerated by the protectionist policies of the Trump administration, which have highlighted the substantial break by the United States from the shared rules built by the international community since the post–World War II period.
As a result, firms now operate in a context marked by greater geopolitical uncertainty and a consequent reallocation of global value chains. In this scenario, real-time monitoring of destination markets takes on strategic relevance: it allows companies to promptly interpret ongoing changes and to orient international positioning decisions more effectively. Today more than ever, strategies for diversifying export markets represent essential levers of adaptation and resilience in the new global competitive arena.
In this context, the update of the World Business Cycle datamart of ExportPlanning allows us to outline a detailed picture of global demand from a geographical perspective, offering an interpretation of the dynamics observed in the first nine months of 2025 across the world’s major markets.
January–September: a country-level map of demand
As highlighted on several occasions, in 2025 global trade in goods has maintained an expansionary pace: overall, ExportPlanning’s preliminary estimates indicate real growth in global demand for goods of 4.6% for the January–September 2025 period. The figure decreases to 3.8% when excluding the U.S. market component, pointing nonetheless to a gradual slowdown and more moderate prospects for 2026.
Not all global markets, however, have supported demand. The following bubble map positions major economies based on their constant-price growth rates in 2024 (X-axis) and those recorded in the first nine months of the current year (Y-axis). This representation provides a clear and synthetic overview of how demand is evolving across geographies, grouped into five color-coded macro-areas: Americas, Asia, EU Europe, non-EU Europe, and MENA.
The bisector (shown in yellow) serves as a key interpretative reference: countries lying along the bisector maintain a growth pace broadly in line with 2024; those below the line show a slowdown in expansion; those above indicate an acceleration. The size of each bubble is proportional to the country’s total import volume in 2024.
Fig.1 – Map of the world’s largest importers
(year-on-year changes at constant prices, January–September 2025)
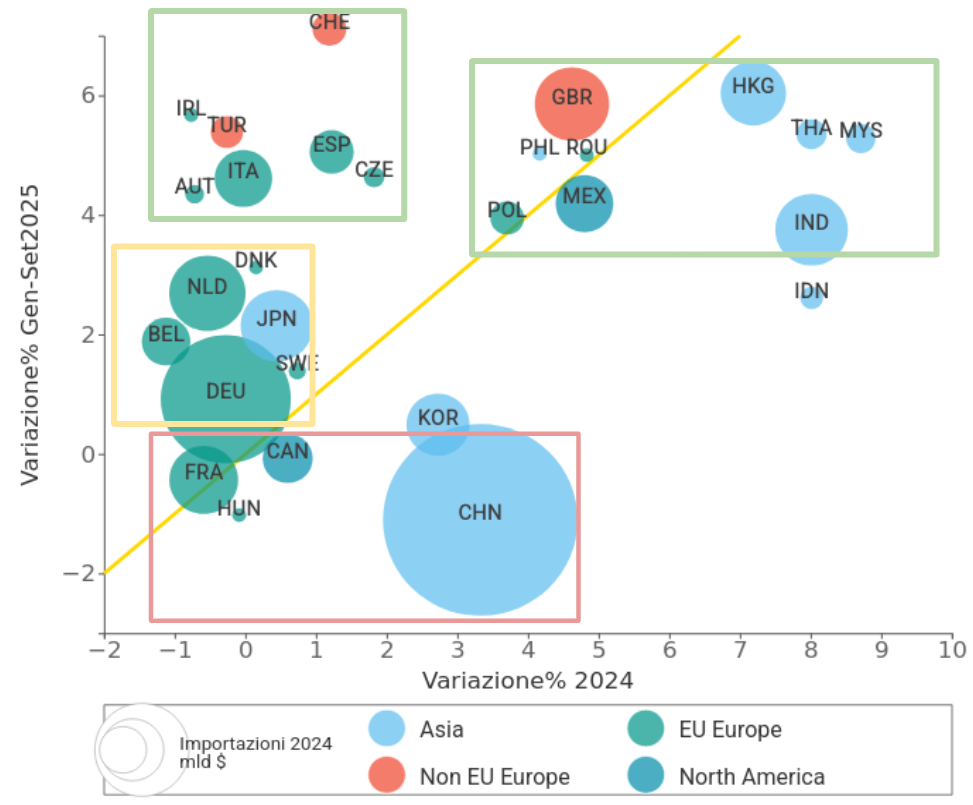
Source: ExportPlanning
The map makes it possible to clearly identify four relevant clusters:
- Markets that remain in growth
This cluster includes markets located at the top right of the chart: geographies experiencing solid growth momentum following an already positive 2024.
Clearly standing out in this area are the ASEAN economies and India, where imports of high-tech goods strongly support foreign demand for manufactures. European economies such as Poland and Romania also appear in this group, showing signs of growth in imports of automotive components and electrical engineering goods. - Markets in strong rebound
This cluster brings together markets located at the top left of the chart: geographies experiencing a marked recovery compared to their weakness in 2024.
The area is populated mainly by European economies such as Spain, Italy, Austria, and the Czech Republic, along with Turkey.
The performance of Ireland and Switzerland is instead heavily influenced by extraordinary movements in investment gold and basic pharmaceuticals, which are subsequently re-exported to the U.S. - Markets in gradual recovery
A second group of recovering economies appears on the left side of the chart, within the yellow quadrant. These countries show signs of import growth but still lag behind the global expansion pace. Once again, the cluster is largely composed of European economies. Standing out among them are the large markets of Germany and Japan.
Interestingly, both countries show increased demand for automotive components, alongside dynamic growth in imports of ICT goods and high-tech equipment. - Markets in difficulty
The red area includes the most troubled economies, where imports show no signs of growth; in the case of China, they even decline. Particularly significant are the reductions in imports of energy commodities and agricultural goods, affected both by retaliation measures in response to U.S. tariffs and by weak domestic demand. The only product clusters showing a counter-trend are those with high technological content, along with demand for semiconductor machinery.
Conclusions
The analysis of demand dynamics across major global markets in the first nine months of 2025 reveals a multifaceted picture.
The cluster classification clearly identifies the most dynamic areas (ASEAN and India), the recovering markets (continental Europe and Turkey), those improving but still lagging global growth (Germany and Japan), and finally, the markets in difficulty, led by China.
From a sectoral perspective, the landscape is equally diversified, with the increasingly central role of high-tech supply chains — particularly those related to ICT, semiconductors, and advanced machinery — becoming ever more evident.
The need for continuous monitoring of demand geographies emerges as essential for anticipating shifts and guiding well-informed strategic decisions. For firms, this implies redefining market priorities, strengthening adaptation capacity, and integrating diversification as a fundamental pillar of international competitiveness.
You may be interested in:

January 2026: the latest data on global trade in goods
Published by Marzia Moccia. .
Slowdown Exchange rate Conjuncture Dollar Euro Foreign markets Uncertainty Global economic trendsThe availability in the ExportPlanning Information System of global trade data for January makes it possible to update the short-term outlook on the most recent dynamics of world trade in goods, wit}... [ Read all ]

Healthcare Industry: Robust Growth in international trade confirmed in 2025
Published by Marcello Antonioni. .
Health products Conjuncture Export Global economic trendsWorld exports of the healthcare industry have been growing strongly, across almost all sectors, but with differences between competing countries [ Read all ]

Electrical Engineering: one of the fastest-growing industrie in international trade 2025
Published by Marcello Antonioni. .
Electronics Conjuncture Export Global economic trendsWorld exports of Electrical Engineering are growing robustly, across almost all sectors, but with differences between competitor countries [ Read all ]