Extrusion machinery: global trade in slows in the second quarter of 2026
Published by Mauro Badanelli. .
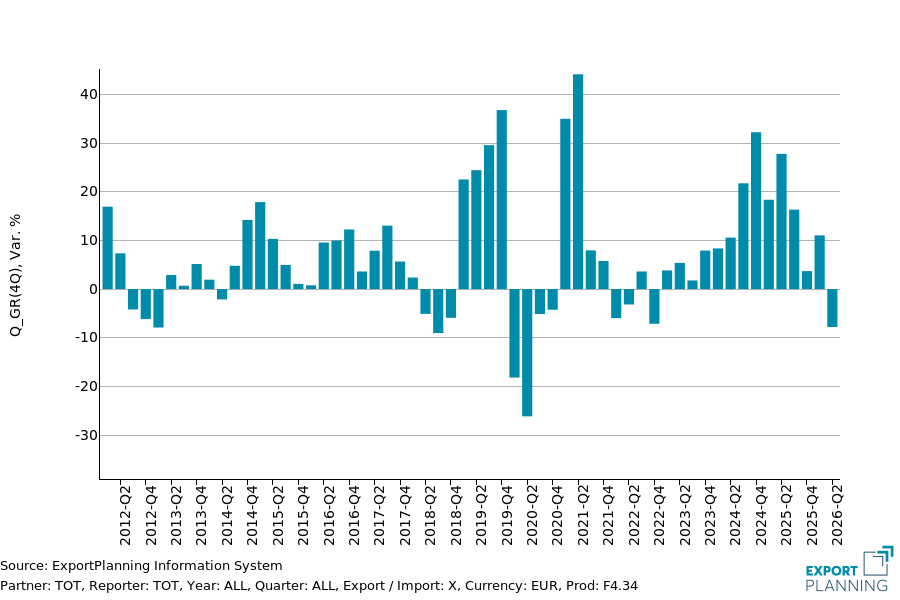
Industrial equipment Conjuncture Industries Global economic trendsBased on the preliminary estimates of international trade data for Q2 2026 available in ExportPlanning, international trade of extrusion machinery recorded a year-on-year decline of -7.8% in constant-price terms (i.e. net of inflationary and exchange-rate effects) in the second quarter. This figure is in contrast with that recorded in Q1, when global sales increased by 11% in constant-price terms.
In Q2-2026, the expansionary phase of
global extrusion machinery exports comes to a halt...
The cumulative value of international trade flows in the first six months of 2026 indicates a slight increase in constant-price terms (+0.8%), marking a clear slowdown compared with 2025, when growth stood at 15.5%. Over the same period, the sector underperformed its broader reference macro-sector, capital goods machinery, which recorded a +3.1% increase in global sales in constant-price terms.
Fig. 1 - Extrusion Machinery - World exports: year-on-year changes at constant prices (%)
Source: ExportPlanning
.. but differences can be observed across
global markets in the sector.
How did the sector's markets perform in Q2-2026?
Leading markets
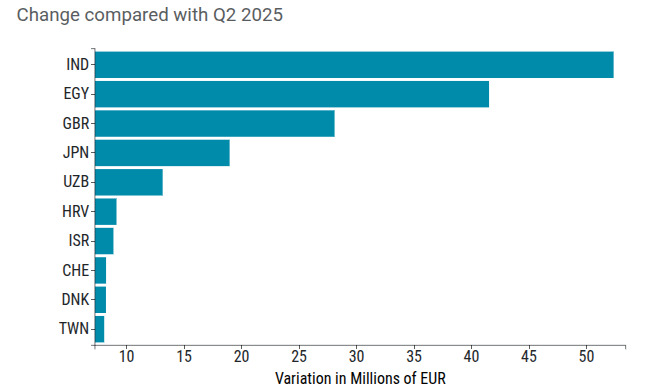
In Q2 2026, the largest year-on-year increases in euro terms were recorded in India (+52.4 million euros compared with the corresponding period in 2025, equal to +21.4%), Egypt (+41.5 million euros, with strong percentage growth of +115.6%), the United Kingdom (+28.1 million euros, +80.7%), Japan (+19.0 million euros, +53.6%) and Uzbekistan (+13.1 million euros, +86.9%).
Fig. 2 - Extrusion Machinery - Import markets with the strongest growth in Q2 2026
Source: ExportPlanning
Among the other markets showing the strongest year-on-year growth in Q2 2026, particularly significant percentage increases were recorded in Croatia (+137.3%), Israel (+88.7%) and Denmark (+87.6%).
Slowing markets
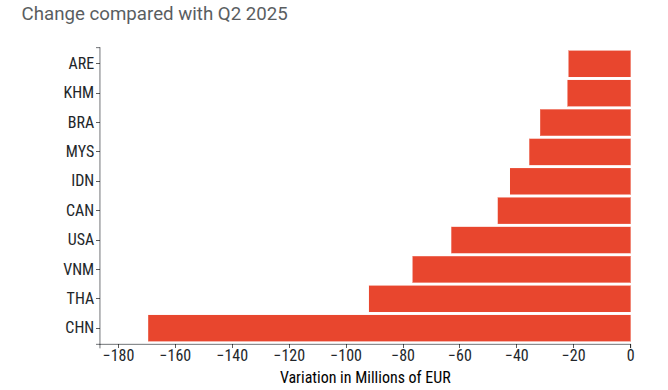
Conversely, in Q2-2026, the largest year-on-year declines in global exports of extrusion machinery in euro terms were recorded towards China (-169.6 million euros compared with the corresponding period in 2025, equal to a decline of -28.6%), Thailand (-92 million euros, due to a 43% decrease), Vietnam (-76.7 million euros, equal to -24.3%) and the United States (-63 million euros, corresponding to a decline of more than 17%).
Fig. 3 - Extrusion Machinery - Import markets with the largest declines in Q2 2026
Source: ExportPlanning
Other global markets recording year-on-year declines in the quarter under review were, in order, Canada (-46.7 million euros compared with Q2 2025, equal to -43.3%), Indonesia (-42.4 million euros, due to a year-on-year decline of 21.1%), Malaysia (-35.6 million euros, due to a 34.2% decrease), Brazil (-31.8 million euros, corresponding to a decline of approximately -27%), and Cambodia (-22.2 million euros, down 21.2%).
Conclusions
The latest data for Q2 2026 point to a deterioration in the cyclical conditions of extrusion machinery sales. In particular, after thirteen consecutive quarters of year-on-year growth at constant prices, the second quarter of the current year recorded a decline.
With regard to destination markets, however, the picture remains heterogeneous, with so-called "leading" import markets, which are growing compared with the same quarter of 2025, and other "slowing" import markets, where the change compared with Q2 2025 was negative.
Manufacturers should focus on identifying, as early as possible, the markets with the strongest year-on-year growth, as these represent the commercial priorities to be monitored in the short term.
To identify the leading and slowing markets for a given sector (or product), visit the ExportPlanning Dashboard
in the Report Environment.
Thanks to the new interactive content available in the Dashboards of the Report environment, the ExportPlanning platform allows users to answer, in just a few clicks, the key questions addressed in this article:
- which are the most dynamic markets ("leading") in the most recent period?
- which are the least dynamic markets ("slowing") in the most recent period?
1) See the list of products included in the analyzed sector in the relevant descriptive sheet.
2) In the World Economic Outlook database of the ExportPlanning Information System, the Quantity at constant prices (Q) measure has been developed. This measure involves a deflation process, whereby the historical series of monetary values (V) is transformed into an equivalent series of values expressed at constant prices, with reference to a specific year, known as the base year. For a description of the methodology applied, please refer to the Methodological Note on the World Economic Outlook database.
You may be interested in:

THE EU EXPORTS OF CAPITAL GOODS IN Q3-2026
Published by Marcello Antonioni. .
Metal industry Conjuncture Export Global economic trendsThe growth in European sales of capital goods (+6.9% year-on-year in euro) was driven by Tools and Equipment for ICT and Services and Electrical Engineering [ Read all ]

Woodworking machinery: Italian exports grow
Published by Mauro Badanelli. .
Internationalisation Industrial equipment Foreign markets Monthly Market Data International marketingNei primi sette mesi del 2026 le esportazioni italiane mostrano un incremento sul 2025, mentre le vendite all'estero dei principali concorrenti calano [ Read all ]

IMF WEO October 2026: Divergent Resilience and Persistent Pressures
Published by Alba Di Rosa. .
Macroeconomic analysis Conjuncture Uncertainty IMF Global economic trendsOn October 13, the International Monetary Fund released its latest World Economic Outlook, a key publication assessing the state of the global economy and its growth prospects. Compared with }... [ Read all ]