HORECA products: Monthly Trade Figures
April 2020: 18% fall in world imports of HORECA products
Published by Giulio Corazza. .
Food&Beverage Conjuncture Consumption pattern Global economic trends
The world economy is going through a period of great uncertainty linked to the intensity and duration of this crisis. In April, world trade collapsed and economists are wondering what direction it will take in the coming months.
Another aspect that is attracting some attention is the change in consumers preferences. It is clear that this crisis is leading a radical change in people's lives - just think of the changes that are taking place on the social level, but especially on the working level - but to what extent will these changes affect consumer habits and choices? And how can we measure this transformation?
Answering these questions is an onerous task and goes far beyond the objective of this article. However, we have taken the opportunity to carry out a sectoral analysis and have gone to analyse the global data on the Horeca food trade, which may be useful to understand these changes as well.
Horeca products fall into the category of goods that are usually sold and distributed through bars and restaurants.
Lockdown policies adopted by countries around the world have imposed major closures on these activities and as a result global demand and trade in Horeca products have also been severely affected.
The following graph shows the trend in world trade in Horeca food products. As can easily be seen, unlike at the beginning of the year when performance was stable, March and April, recorded a significant contraction. Looking at the side of imports, March 2020 recorded a fall of -4.5% while the month of April was even more negative by -18%.
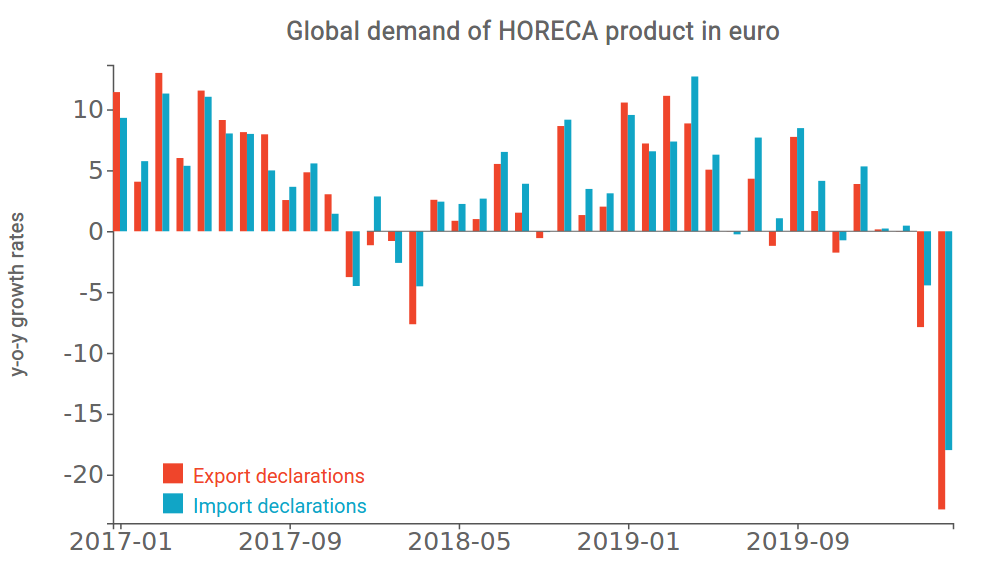
Source: ExportPlanning
Within the Horeca category, not all products were affected in the same way.
Alcoholic beverages, for example, were the ones that suffered the greatest contraction. For the month of April, demand for liquors and vermouth fell by over -30% while demand for wine and beer fell by -25%. Trade in fish and ice cream was also hit hardest, falling by -22% and -20% respectively.
Coffee, on the other hand, was the product that suffered the least from the effects of the lockdown and its demand fell by only 5%, showing how the consumption of coffee at home has substituted the consumption in bars and retaurants.
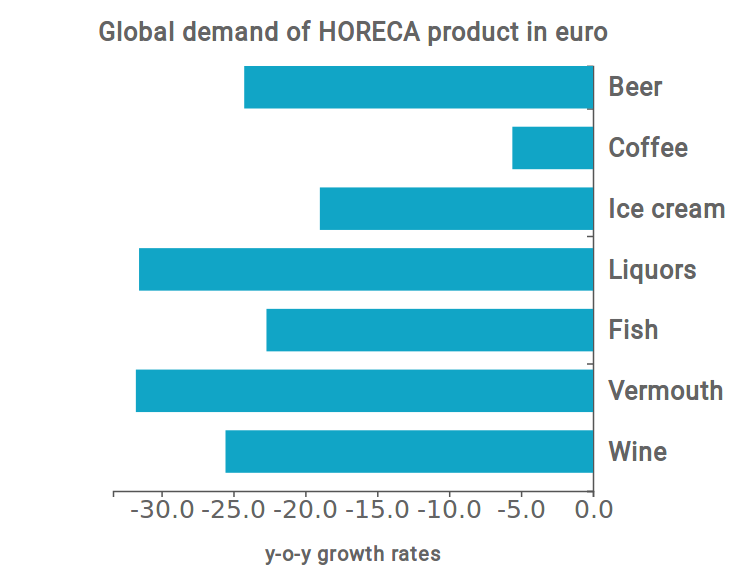
Source: ExportPlanning
In order to try to understand if the dynamics of world trade can also be traced back to structural changes in the consumption preferences of the users of the Horeca channel, we went to build an experimental index that expresses the intensity of frequentation of these channels.
Usually such surveys are conducted by specialized companies through market research. Conducting this type of survey is a very onerous task and only large companies can afford it, not small/medium companies whose funds are often limited.
To this end, Studiabo has created a simple popularity index for the Horeca product channel. This was built with the help of Google Trends, going to analyze the popularity on the web of two search terms: 'restaurants' and 'pizza'.
The index is therefore the ratio between the frequency of the term 'restaurants' and the frequency of the term 'pizza'. Just as it has been constructed, an increase in the index expresses an increase in the search frequency of the term 'restaurants' or a decrease in 'pizza' while a decrease expresses an increase in the term 'pizza' or a decrease in 'restaurants'. In this way the index trend should reflect the popularity of Horeca food products.
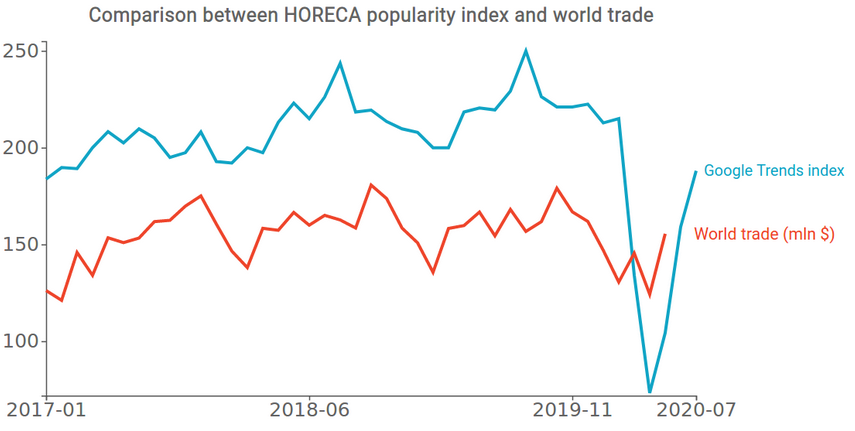
Source: ExportPlanning
In the chart above, the index is compared with world trade trends. Looking at it you can see that the dynamics of the two series is very similar. The index follows quite closely the trend of world trade and in some cases it also seems to be able to anticipate its changes. There is therefore a good sign of positive correlation.
Currently, the index seems to indicate a recovery in Horeca channel attendance, however, there is still a significant difference compared to pre-crisis levels.
It is clear that this figure should be taken with caution and cannot replace a more in-depth analysis. It may, however, be useful in a broader study to understand the trend of this phenomenon.
You may be interested in:

World Trade Trends: International Trade Results in Q2 2026 (Preliminary Estimates)
Published by Marcello Antonioni. .
Home items Fashion Food&Beverage Metal industry Intermediate goods Electronics Chemicals Industrial equipment Conjuncture Automotive Global demand Industries Global economic trendsStrengthening dynamics, driven by AI applications, and the green and digital transitions [ Read all ]

US Trade Deficit Put to the Test by Tariffs: Evidence from First-Half 2026 Data
Published by Marzia Moccia. .
Slowdown Conjuncture United States of America Uncertainty Trade war Foreign market analysisAmid uncertainty that has now become the new normal, international geopolitical tensions, and the reshaping of the rules governing global trade, the United States undoubtedly remains a key focus of }... [ Read all ]

Plastics processing machinery: what are the main markets and how is the competitive landscape evolving?
Published by Mauro Badanelli. .
Industrial equipment Conjuncture Industries International marketingPlastic processing machinery represents one of the most important technological pillars of modern manufacturing supply chains. Through processes such as injection moulding, extrusion, blow moulding }... [ Read all ]