US International trade figures: light and shadow
US trade flows show signs of recovery in June-July; positive results for export flows to China
Published by Marzia Moccia. .
Covid-19 Conjuncture United States of America Trade balance Trade war Global economic trends
The update of US Quarterly International Trade database allows an analysis of the dynamics of U.S. international trade in light of the country's strong exposure to the Covid19 pandemic.
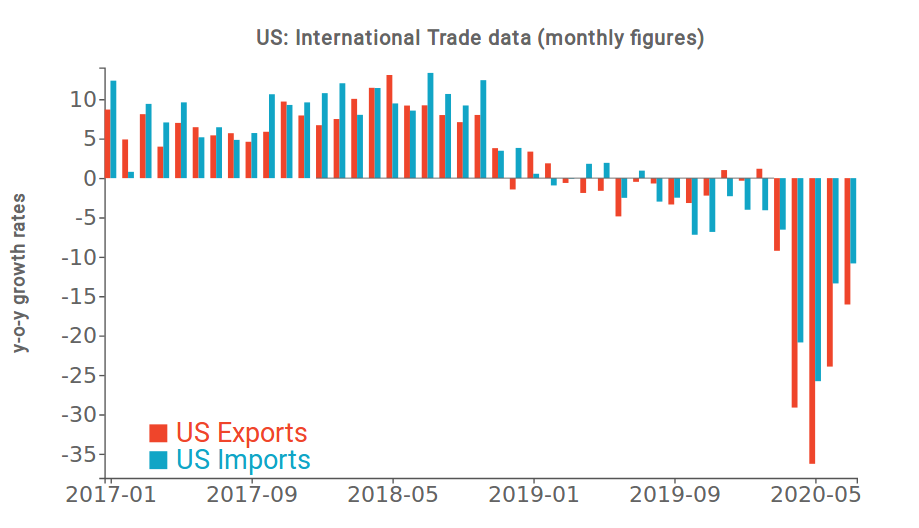
The following graph shows the variation in monthly import and export values over the corresponding period of last year; it should be noted that in the two-month period April-May US trade flows showed the most significant contractions. On the import side, the American market recorded a y-o-y drop of 22%; the y-o-y contraction recorded by exports, close to 32%, was definitely more marked. During the following two-month period, June-July, on the other hand, there was a slight recovery, which would seem to indicate a "V" shaped recovery in US international trade flows.
Source: ExportPlanning
Exports figures appear more negative compared to the imports' scenario: in June-July the drop in imports was close to -12% y-o-y, against a contraction in exports amounting to -20%.
In fact American exports still show marked decreases, although the recovery signed on almost all the main export markets.
The graph below shows the main American export markets on the basis of the y-o-y variation rate recorded in the two-month period April-May and June-July; the size of each ball is proportional to the 2019 value of exports.
Source: ExportPlanning
With the exception of Japan, US exports report a generalized recovery to the main international export markets. The recovery compared to April-May is significant towards some European partners, such as Ireland and Germany, and towards several Asian markets, such as Taiwan and Malaysia, which nevertheless play a marginal role in the US market portfolio.
In slight recovery, but still with double-digit downturns, the two main American trading partners, Canada and Mexico, which are part of the new USMCA agreement; to these are added European partners such as Italy and United Kingdom.
At the bottom left of the graph we find economies for which the effects of the pandemic crisis are still strongly repressive for the restart of demand, this is the case of India and Brazil, and Spain and France on the European front.
The US performance on the Chinese market is clearly against the trend, showing a positive dynamics both in the two-month period April-May and June-July. The result is largely due to the contractual obligations signed by Beijing in trade agreement with the US, in force since last February. As highlighted in the article Focus on: Phase One US-China Trade Deal, one of the requirements of the agreement provides for an increase in the purchase of U.S. goods and services for an amount of $200 billion compared to 2017, in 2020-21 horizon. The list of different products is widely regulated and concerns an increase of $77.7 billion in two years of manufacturing products, $32 billion of agricultural products, $52.4 billion of energy products and $37.9 billion of services.
Although in the first part of the year the effects of the Covid-19 pandemic strongly delayed China's purchases, trade data seem to highlight Beijing's commitment to fulfilling its contractual obligations under the trade agreement, as highlighted during the meetings of the respective trade representatives in last days of August (for more details see link).
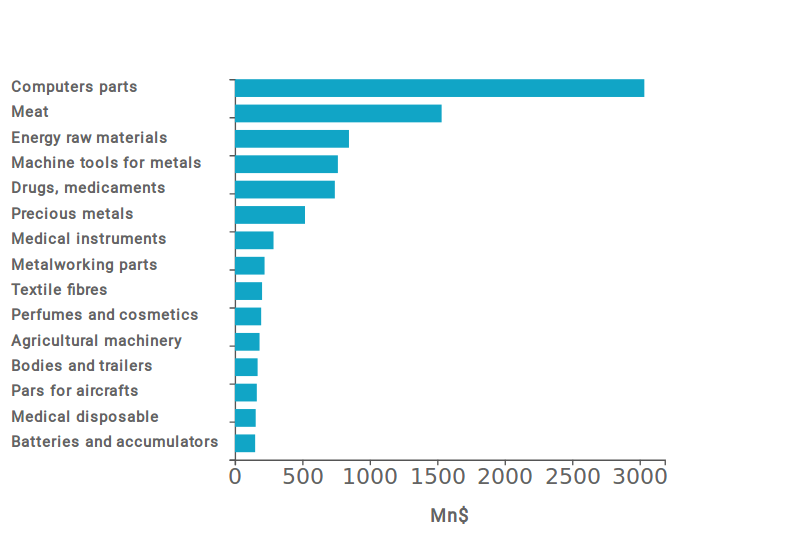
By analyzing the data on trade flows 2017 (base year included in the agreement) and the latest available data, it is possible to report some manufacturing sectors for which China has significantly increased its imports (see graph below).
Main increases in U.S. exports to China
(absolute change first 7 months 2020 over first 7 months 2017)
Source: ExportPlanning
The most significant increases have been recorded in computer parts, especially processors, in meat exports and in energy products. Overall, only for the three sectors just mentioned, the increase was close to 5.5 billion $ in the first 7 months of the year (compared to the corresponding period 2017). This marked increase is in addition to the increase recorded for pharmaceuticals and medical equipment (close to $1 billion), goods needed to cope with the epidemic, and that for other types of investment goods.
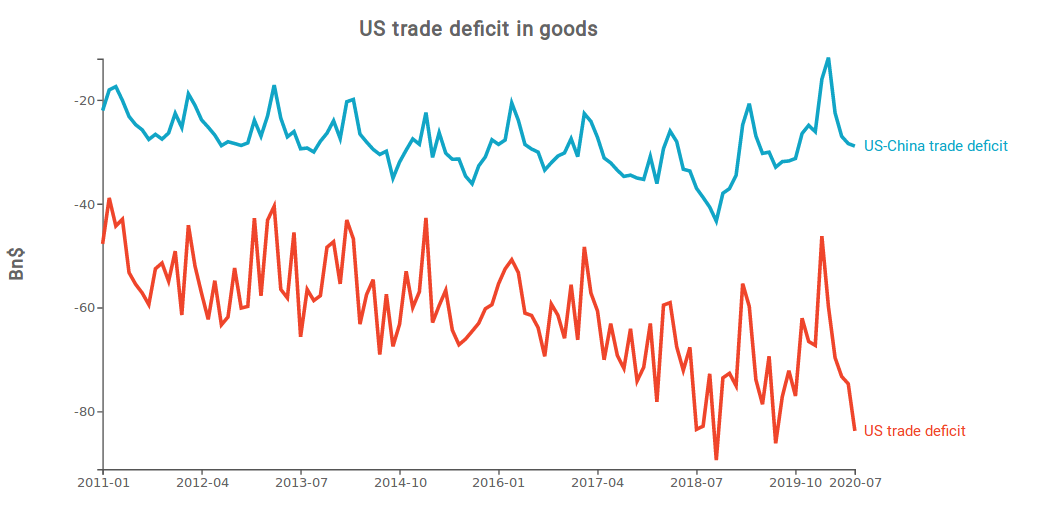
Although the process of strengthening of the American presence in the Chinese market still seems far from materializing, world trade data show reassuring signs. Net of some short-term fluctuations, the US-China trade deficit in goods continues along the trend of reduction started in the second part of 2019; trend that cannot be said to be equally consolidated for the total U.S. trade deficit, as shown in the figure below.
Source: ExportPlanning
You may be interested in:

IMF WEO Update July 2026: a (precarious) balance between war and technology
Published by Alba Di Rosa. .
Macroeconomic analysis Asia Emerging markets United States of America Uncertainty IMF Eurozone Global economic trendsPer il 2026 il Fondo ha rivisto lievemente al ribasso le stime di crescita del PIL mondiale, ora previsto al +3% [ Read all ]

US Trade Deficit Put to the Test by Tariffs: Evidence from First-Half 2026 Data
Published by Marzia Moccia. .
Slowdown Conjuncture United States of America Uncertainty Trade war Foreign market analysisAmid uncertainty that has now become the new normal, international geopolitical tensions, and the reshaping of the rules governing global trade, the United States undoubtedly remains a key focus of }... [ Read all ]

Plastics processing machinery: what are the main markets and how is the competitive landscape evolving?
Published by Mauro Badanelli. .
Industrial equipment Conjuncture Industries International marketingPlastic processing machinery represents one of the most important technological pillars of modern manufacturing supply chains. Through processes such as injection moulding, extrusion, blow moulding }... [ Read all ]