Food Machinery: United States continues to be the leading market. Which states are driving the growth?
In the first quarter of 2024, the USA is by far the most dynamic market for global exports in the sector
Published by Marcello Antonioni. .
Marketselection Industrial equipment Check performance United States of America Export markets American States Global economic trendsWorldwide exports of Food Machinery
World trade data for the first quarter of 2024, available in the World Trade Datamart, highlight - after a phase of significant slowdown in euro values - signs of strengthening of world exports of Food Machinery1: +10.5% in euro values (+4.8% at constant prices) compared to the corresponding period 2023.
In the first quarter of the year, global sales of food machinery, although penalized by the declines in the markets of Russia, Australia, Poland and China, found support, once again, from the US market (+367.8 million euros compared to the corresponding period in 2023) and, to a lesser extent, from Brazil, Mexico and United Arab Emirates.
The US market is therefore confirmed as the main destination for global sales of Food Machinery (with approximately 3.8 billion euros in 2023)2, destination driving global demand for the sector: in the period 2020-2023, global sales of Food Machinery aimed at the US market grew overall by over 1.3 billion euros, clearly the largest increase relevant among the world markets of sector3.
From 2019 to today, the US market has shown an overall increase in imports of Food Machinery from the world
of almost 1.7 billion euros
World Exports of Food Machinery:
main driving markets in the 1st quarter of 2024
| Level 2023 | Delta (Million €) | ||
| Market | (Billion €) | 2023/2019 | Q1-2024/Q1-2023 |
| United States | 3.8 | +1 306 | +367.8 |
|---|---|---|---|
| Brazil | 0.4 | - 60 | + 63.7 |
| Mexico | 0.7 | + 29 | + 58.6 |
| United Arab Emirates | 0.2 | + 55 | + 36.6 |
| India | 1.0 | + 285 | + 32.3 |
| Japan | 0.5 | - 20 | + 31.1 |
| Indonesia | 1.1 | + 257 | + 29.4 |
Source: ExportPlanning - Quarterly World Trade Datamart
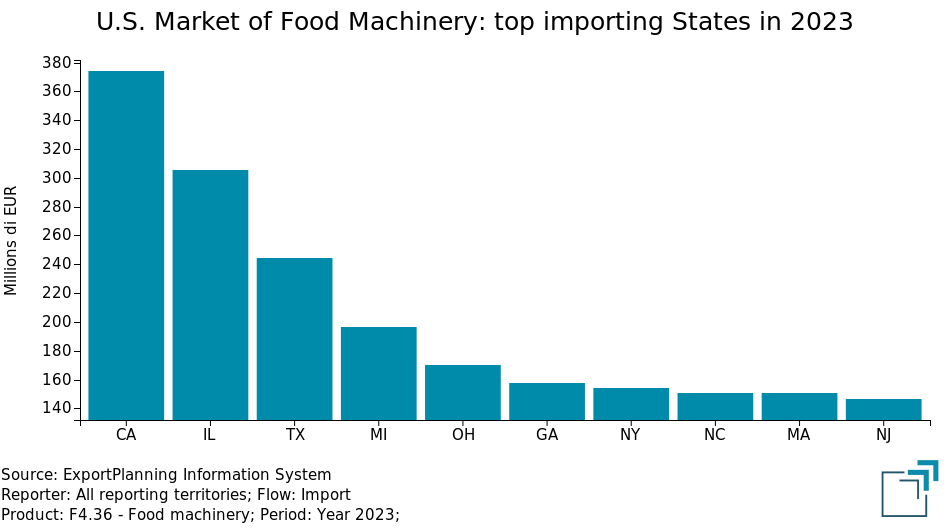
Total imports of Food Machinery by American states
The import data for the United States, broken down by state and partner country, available in the Quarterly Trade of American States Datamart, allow to document, within the US market, the most relevant geographical areas and those driving the overall demand (and from Italy) for food machinery in the period most recent.
In particular, in the 2023 final balance we note the record of imports of food machinery from California [CA] (374 million euros), followed by Illinois [IL] (306 million €), Texas [TX] (244 million €), Michigan [MI] (€197 million), Ohio [OH] (€170 million), Georgia [GA] (€158 million), New York [NY] (€154 million),North Carolina [NC] (€151 million), Massachusetts [MA] (€150 million) and New Jersey [NJ] (€147 million).
With reference to the period 2020-2023, however, the major contributions to the growth of US imports of Food Machinery are derived - in order - from the markets of Michigan (+142.4 million euros), Ohio (+96.6 M €), California (+92.9 M €), Florida (+92.7 M €) and Georgia (+91 M €).
Finally, the table below shows the American States that have highlighted the greatest year-over-year increases in imports of Food Machinery in the first three months of 2024. Above all, the performance of the State of Michigan (+68.8 million euros compared to the corresponding period in 2023), followed by those of Texas (+39.9 M €), California (+25.4 M €), Washington (+18 M €), Kentucky (+10.5 M €) and Pennsylvania (+10.4 M €).
U.S. Imports of Food Machinery:
main driving States in the 1st quarter of 2024
| Level 2023 | Delta (Millions €) | ||
| American State | (Millions €) | 2023/2019 | Q1-2024/Q1-2023 |
| Michigan | 197 | +142.4 | +69.8 |
|---|---|---|---|
| Texas | 244 | + 73.1 | +39.9 |
| California | 374 | + 92.9 | +25.4 |
| Washington | 50 | + 4.0 | +18.0 |
| Kentucky | 34 | + 14.0 | +10.5 |
| Pennsylvania | 141 | + 37.2 | +10.4 |
Source: ExportPlanning - Quarterly Trade of American States Datamart
Conclusions
The data for the first quarter of 2024 confirmed the driving role of the US market for worldwide sales of Food Machinery4.
In particular, the US food machinery market shows widespread growth at a territorial level.
The analysis of quarterly imports from American states, which can be broken down by partner country, can allow us to document the territories of the US market that are continuing to offer positive contributions to the growth of global sales of Food Machinery.

1) See the list of products included in this analysis in the following table.
2) In the 2023 world food machinery markets, behind the United States are China (2.4 billion euros) and - further away - Germany (1.3 Bn €), Indonesia (1.1 Bn €) and Russia (1 Bn €), with only the Indonesian market growing in the most recent quarter.
3) In the 2020-2023 period, well behind the US market, we note - in absolute increases - the growth of the markets of China (+481 million euros), Turkey (+381 M €), Germany (+304 M €), United Kingdom (+290 M €) and India ( +285 M €).
4) In particular, in 2023 the US market ranked first in the world for imports of machines and equipment for baking, machines and equipment for industrial meat processing, machines and apparatus for mixing and kneading and machines for the manufacture of sugar and confectionery products.
You may be interested in:

Plastics processing machinery: sectors where Italy leads the way
Published by Mauro Badanelli. .
Industrial equipment Foreign markets International marketingAs documented in this article, Italy ranks among the world's leading exporters in the plastics processing machinery industry, holding the 3rd position worldwide in 2025. The aim of this analy}... [ Read all ]

IMF WEO Update July 2026: a (precarious) balance between war and technology
Published by Alba Di Rosa. .
Macroeconomic analysis Asia Emerging markets United States of America Uncertainty IMF Eurozone Global economic trendsPer il 2026 il Fondo ha rivisto lievemente al ribasso le stime di crescita del PIL mondiale, ora previsto al +3% [ Read all ]

US Trade Deficit Put to the Test by Tariffs: Evidence from First-Half 2026 Data
Published by Marzia Moccia. .
Slowdown Conjuncture United States of America Uncertainty Trade war Foreign market analysisAmid uncertainty that has now become the new normal, international geopolitical tensions, and the reshaping of the rules governing global trade, the United States undoubtedly remains a key focus of }... [ Read all ]