US imports of goods after Liberation Day
US imports slow down in April-May 2025 after the boom in the first quarter
Published by Silvia Brianese. .
Conjuncture United States of America Trade war Foreign market analysisThe latest update on US foreign trade data, collected by ExportPlanning within the US Economic Outlook datamart, allows monitoring of US foreign demand for goods after the tariff announcement on April 2.
As anticipated in the article "U.S. Imports in Q1 2025: Gold, Pharmaceuticals, and Technology Lead the Surge", in the first quarter of 2025 nominal goods imports increased by 25% compared to the same period in 2024, due to the phenomenon of “front-loading”, i.e. the anticipation of purchases by the US market in view of tariffs. However, in April and May 2025, a significant slowdown is observed, with year-on-year growth settling at a “modest” 1.7% in April and 0.35% in May.
The chart below shows the historical series of monthly US import growth rates.
Fig.1 - US Imports
(YoY changes in USD)
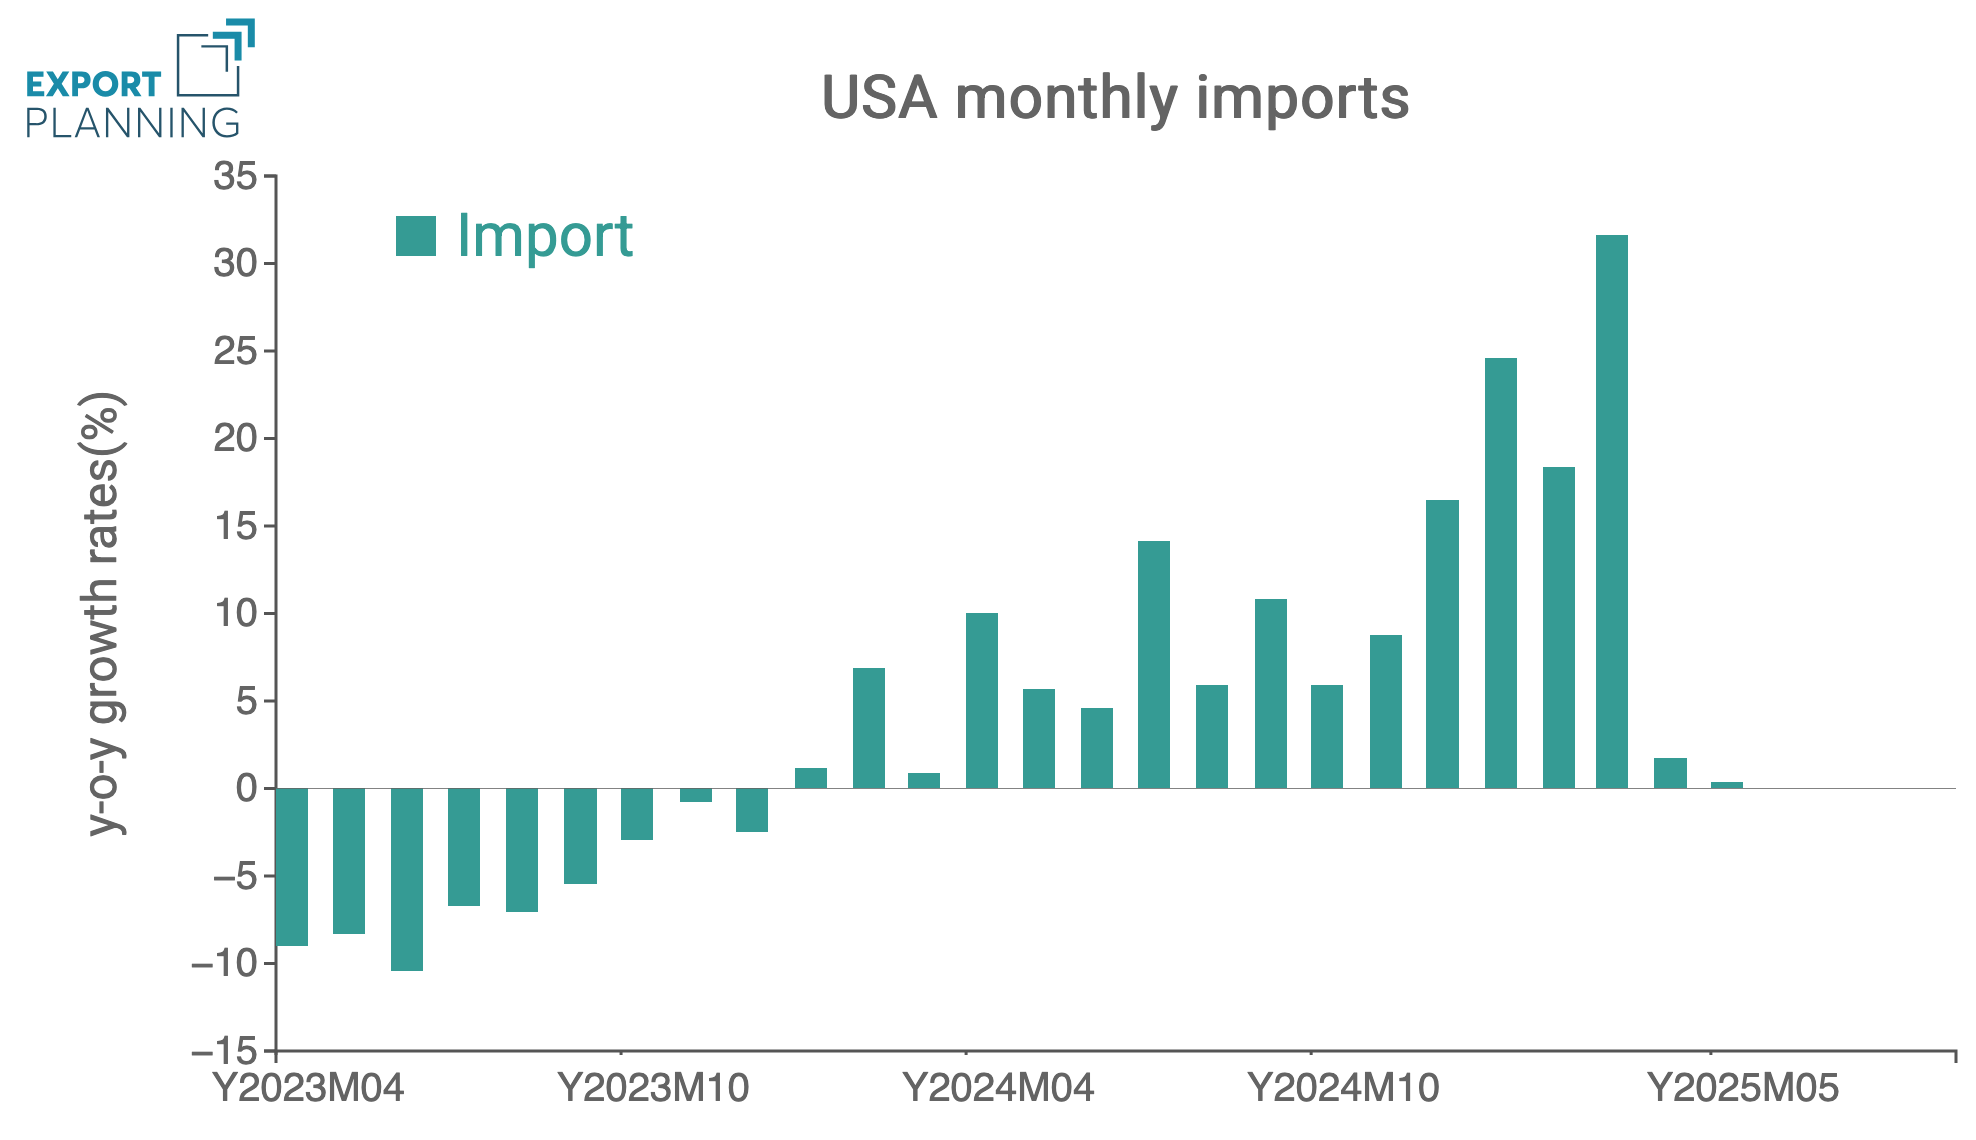
The trend in US imports is particularly interesting if read in light of recent dynamics: starting from November 2024 (the period following Trump’s presidential victory), goods imports recorded significant growth, peaking in March 2025 alone with an increase of over 30%.
One possible interpretation of this trend is the so-called “inventory effect”, aimed at anticipating the impact of tariffs on US imports. However, as discussed in the article above, this hypothesis must be assessed with caution as it is necessary to consider both the sectors involved and their respective tariff rates, as well as the context of trade uncertainty and geopolitical tensions that characterised this period.
However, from April 2025 onwards – coinciding with the entry into force of the first "reciprocal" tariffs – initially introduced as “minimum” tariffs of 10% for all trading partners except China – US import growth slowed sharply. Breaking down these imports by trade partner allows for a more detailed analysis of the dynamics for the main US trading partners in these past two months.
US import dynamics in April and May 2025: an assessment by trading partner
The chart below shows the top 25 countries from which the US imported the most in 2024, comparing the year-on-year variation in US imports in Q1 2025 with that recorded in April and May 2025 compared to the same period in 2024.
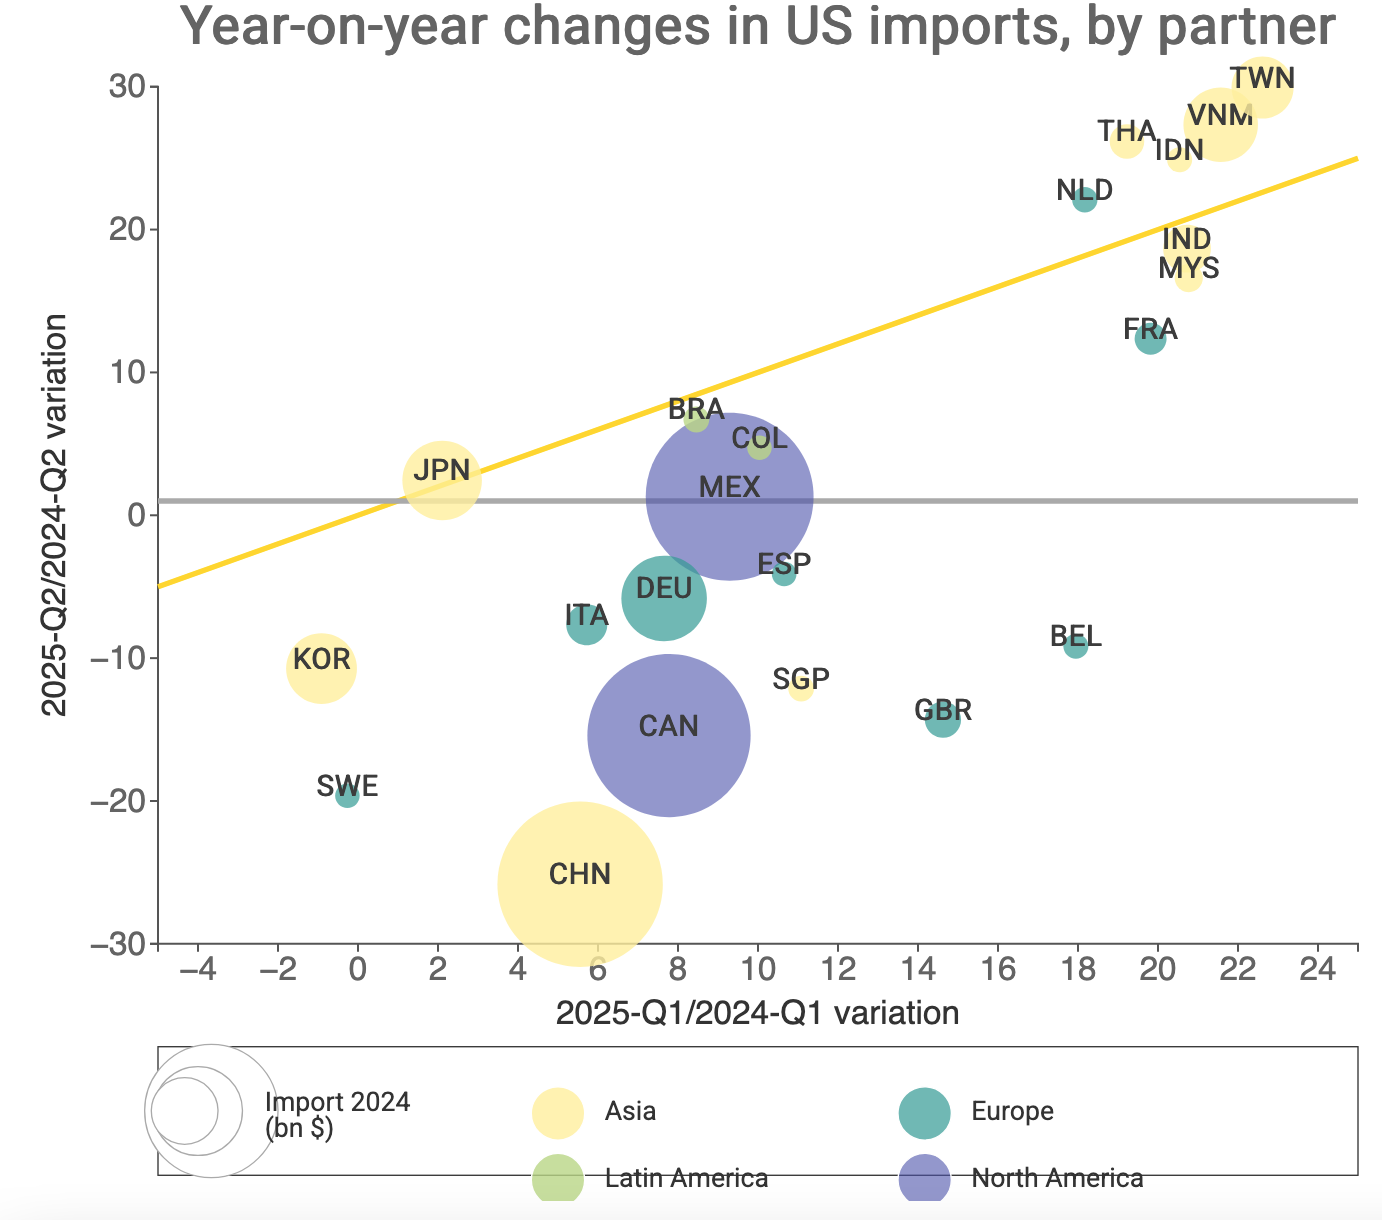
It can be observed that US imports of goods from Taiwan, Vietnam, Indonesia, Thailand, the Philippines, India, and Malaysia continued to grow even after the US tariff announcement, positioning these countries in the top-right cluster of the chart. This positive performance cluster also includes two European countries, Netherlands and France, which recorded positive year-on-year changes both in the first three months of 2025 and in April and May, despite the entry into force of the 10% tariffs.
Conversely, after Liberation Day, US imports contracted from major European exporting countries such as Italy, Germany, and Spain. For these countries, the decline in foreign demand for goods averaged around 5%, thus lower than the 10% tariff rate. However, US imports from Belgium, the United Kingdom, Canada, and Singapore saw a contraction exceeding 10% in April-May 2025.
Finally, regarding US imports from China, after a slightly positive Q1 2025, April-May recorded a year-on-year variation of -30%, highlighting the first effects of significant US tariff rates on Chinese products.
The sectors driving US imports from various partners in early 2025
The positioning of different countries in the previous chart reflects both the extent of bilateral tariff rates imposed by the US and the presence of specific sectors or products that remained competitive in the US market.
In particular, Asian economies stand out, demonstrating the deep supply chain linkages that exist.
Specifically, US imports from Taiwan, Vietnam, Thailand, Malaysia, and Indonesia mainly benefited from the increase in imports of ITC equipment (computers, electronic components, consumer electronics, electrical equipment). Furthermore, Vietnam also saw increased exports to the US of fashion system products (outerwear, underwear, hosiery, bags and luggage) and home items (furniture, mattresses, furnishings). It is therefore no coincidence that the first "tariff letters" sent on July 7 targeted precisely these geographies, except Vietnam, with which a trade agreement was announced.
A focus on European countries: the case of France and the Netherlands vs major European exporters
Undoubtedly, what has supported European exports to the US market is the pharmaceutical and health system supply chain – currently not affected by tariffs and characterised by strong supply chain ties with the US market. However, for some Member States, there are other resilient sectors even after the introduction of the 10% tariff rate. Specifically:
- the semiconductor manufacturing machinery sector, food machinery, and lifting and handling machinery from the Netherlands;
- the food sector (alcoholic beverages and dairy products) and fashion system (jewellery and leather goods) from France.
Finally, other sectors that helped limit the decline in exports to the US following the imposition of the 10% tariff on European goods include the electrical engineering sector (for Germany and Spain) and the home system and packaged food (especially pasta, rice, and flour) for Italy.
Conclusions
Through the analysis of US foreign trade data, it is possible to gain an initial insight into the effects of tariffs on US imports. The data confirms a strong “front-loading effect” in Q1 2025, followed by a slowdown in April-May, with differing dynamics among trading partners and sectors. Clusters of countries and sectors emerge which, thanks to their specialisation, manage to maintain stable or growing export levels despite increased tariff barriers.
An interesting insight from this analysis concerns the trend in average unit prices and relative trade elasticity, which strengthens the hypothesis of specialisation in favour of market competitiveness, to be further explored in upcoming dedicated analyses.
You may be interested in:

Amid tariffs and uncertainty, the downsizing of US imports continues
Published by Alba Di Rosa. .
Dollar United States of America Trade balance Export Trade war Import Foreign market analysisThe US Census Bureau recently released the latest foreign trade data, updated as of February 2026, and now available on the ExportPlanning platform [ Read all ]

January 2026: the latest data on global trade in goods
Published by Marzia Moccia. .
Slowdown Exchange rate Conjuncture Dollar Euro Foreign markets Uncertainty Global economic trendsThe availability in the ExportPlanning Information System of global trade data for January makes it possible to update the short-term outlook on the most recent dynamics of world trade in goods, wit}... [ Read all ]

Healthcare Industry: Robust Growth in international trade confirmed in 2025
Published by Marcello Antonioni. .
Health products Conjuncture Export Global economic trendsWorld exports of the healthcare industry have been growing strongly, across almost all sectors, but with differences between competing countries [ Read all ]