China keeps leading the way in the production of technical sportswear
Published by Mauro Badanelli. .
Covid-19 Internationalisation Industries Foreign market analysisAs highlighted in a recent article on the technical textiles sector and its application areas, the Sporttech segment and specifically technical sportswear (i.e. sports apparel made with high-performance fabrics – breathable, heathable, water-repellent, etc.) has recorded the strongest growth in international trade over the past five years. The average annual growth rate (CAGR) of global trade stood at 2.7% at constant prices between 2019 and 2025, with a 7.5% increase in the last year.
Figure 1 shows that the trend in global trade of technical sportswear between 1995 and 2025 has been clearly positive, except for the evident slowdown in 2020, coinciding with the pandemic, which also hampered global trade in this sector.
Fig. 1. Global trade of technical sportswear
(billion euros)
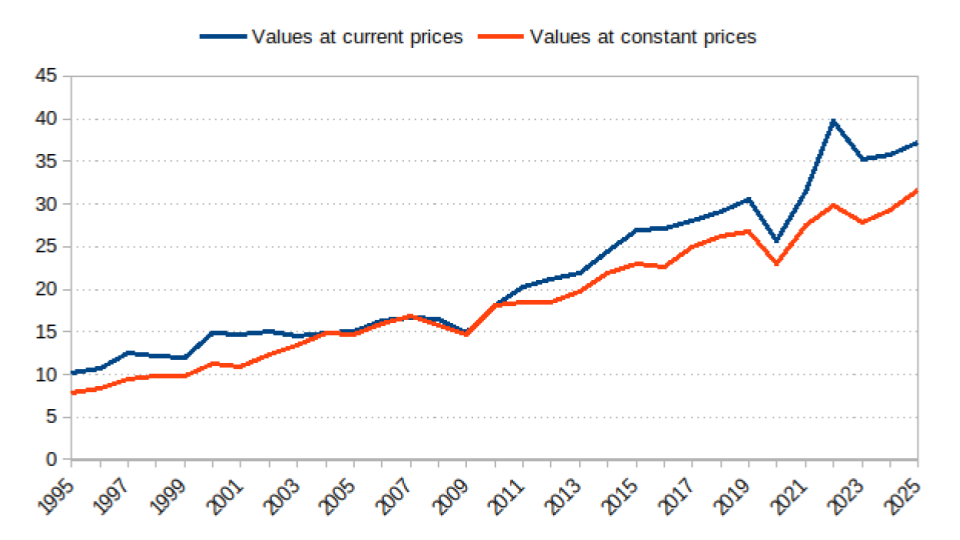
Source: ExportPlanning processing
Asia: the main production area for technical sportswear
Thanks to data available in the ExportPlanning information system, it is possible to analyze how the competitive landscape in the sector has evolved. In particular, production of technical sportswear has clearly shifted towards Asia between 2010 and 2025, as shown in Table 1.
Tab. 1. Technical sportswear production by geographical areas
(% change at constant prices)
| Area | 2025 (million euros) |
CAGR% 2025/2010 |
CAGR% 2025/2019 |
|---|---|---|---|
| China | 21 854 | +6.68 | +4.81 |
| Asia (excluding China) | 9 839 | +1.74 | -0.21 |
| EU Europe | 6 084 | +0.77 | -1.67 |
| Non-EU Europe | 2 051 | +4.48 | +0.44 |
| NAFTA | 1 520 | -1.65 | -0.64 |
| Middle East and North Africa | 1 313 | +0.02 | -6.72 |
| Latin America | 369 | -0.71 | +0.63 |
| Sub-Saharan Africa | 119 | +3.04 | +7.49 |
| Oceania and South Africa | 60 | -2.52 | -4.31 |
Source: ExportPlanning
China, in particular, has strengthened its leadership as the main producing country in the sector over the last 15 years. The average annual growth rate of technical sportswear production reached 6.68% at constant prices. No other geographic area recorded a similar increase. For Asian Countries (excluding China), the CAGR stood at +1.74%. Non-EU European Countries recorded a production increase of 4.48% between 2010 and 2025.
An analysis of the last six years (2019–2025) shows a scenario in which China maintained a clearly positive trend, despite the Covid-19 pandemic (+4.81%), compared to a downsizing of production in the main geographic areas. Starting with other Asian Countries, production remained essentially stable between 2019 and 2025. Non-EU Europe also showed substantial stability, while production in the EU area declined by about 2%.
The strengthening of China, and more generally Asian Countries, in the production of technical sportswear follows trends observed in other sectors, especially in the broader textile and apparel industry: cost-saving strategies have led to a redefinition of production geography towards countries with lower production costs compared to those producing high value-added technical textiles.
Are you interested in receiving a selection of the most relevant weekly news on foreign trade? Subscribe for free to the World Business Newsletter!
Production dynamics by Country
An analysis of producing countries confirms that, alongside China, other Asian countries rank at the top. Vietnam shows the highest growth over the last 15 years with a CAGR of 10.40%, reflecting the massive relocation of production by Chinese companies in the sector. The 6-year CAGR of 9% indicates that this acceleration is still ongoing.
Bangladesh has grown steadily, reaching €778 million in 2025, with a 15-year CAGR just under 10%, positioning itself as an increasingly important low-cost production hub.
India is the third-largest producer, also thanks to strong investments by Indian authorities to develop the national technical textiles sector. Average annual growth between 2010 and 2025 was 7.15%, while the 2019–2025 CAGR is negative (-5.86%). Technical sportswear production experienced a slowdown, partly due to specialization in other application sectors (packaging and geotextiles).
Among European countries, Turkey is the leading producer, with an almost flat growth rate between 2019 and 2025 (-0.29%). The country maintains its position but fails to grow, despite its geographical proximity to European markets. Italy is the most critical case: the 6-year CAGR is -6.65%, with production reaching €906 million in 2025. Germany also recorded a decline over the last six years (-2.22%). Spain and the Netherlands, on the other hand, show positive CAGRs over both time horizons, suggesting specialization in niche production segments.
Tab. 2. Main technical sportswear producing countries
(% change at constant prices)
| Country | 2025 (million euros) |
CAGR% 2025/2010 |
CAGR% 2025/2019 |
|---|---|---|---|
| China | 21 854 | +6.68 | +4.81 |
| Vietnam | 1 612 | +10.40 | +9.01 |
| India | 1 612 | +7.15 | -5.86 |
| Turkey | 1 059 | +4.15 | -0.29 |
| Italy | 906 | -2.33 | -6.65 |
| United States | 889 | -1.61 | -1.70 |
| Germany | 844 | +1.13 | -2.22 |
| Spain | 823 | +5.44 | +1.24 |
| Netherlands | 785 | +7.27 | +6.84 |
| Bangladesh | 778 | +9.88 | +4.81 |
Source: ExportPlanning
Conclusions
The overall picture describes a profound geographical restructuring of technical sportswear production:
- The production hub is definitively shifting towards Southeast Asia (China, Vietnam, Bangladesh);
- Traditional manufacturing Europe (especially Italy) is under strong competitive pressure, intensified after 2019;
- United States confirms a steady production decline, consistent with the service-based transformation of its economy;
- The 2020 crisis caused by the Covid-19 pandemic likely accelerated trends already underway, impacting Western producers asymmetrically
The ability to capture international B2B opportunities today requires understanding how global production geographies evolve, through a structural analysis of customer segments and the competitive landscape, based on up-to-date and granular data. In this context, the ExportPlanning information system enables mapping the evolution of key customer sectors through production data available for 150 countries.
From this perspective, the value of customer segment analysis lies primarily in the ability to interpret the geographical reallocation of production, identifying more precisely the new industrial hubs where demand for textile machinery and garment manufacturing technologies is concentrated.
```You may be interested in:

World Trade Trends: International Trade Results in Q2 2026 (Preliminary Estimates)
Published by Marcello Antonioni. .
Home items Fashion Food&Beverage Metal industry Intermediate goods Electronics Chemicals Industrial equipment Conjuncture Automotive Global demand Industries Global economic trendsStrengthening dynamics, driven by AI applications, and the green and digital transitions [ Read all ]
Denim: how global trade is changing amid new materials and competitive pressure
Published by Mauro Badanelli. .
Fashion Internationalisation Export International marketingThe evolution of denim in fashion Denim is one of the most iconic and versatile fabrics in the history of apparel. Its origins date back to the 17th century and are linked both to the Italian cit}... [ Read all ]

Plastics processing machinery: what are the main markets and how is the competitive landscape evolving?
Published by Mauro Badanelli. .
Industrial equipment Conjuncture Industries International marketingPlastic processing machinery represents one of the most important technological pillars of modern manufacturing supply chains. Through processes such as injection moulding, extrusion, blow moulding }... [ Read all ]