Growth in World Trade of Manufactured Goods Shows Signs of Easing
Supply chain disruption, shipping delays and rising commodity prices threaten global recovery
Published by Marzia Moccia. .
Slowdown Covid-19 Conjuncture Total goods Industries Foreign markets Global economic trends
ExportPlanning pre-estimates for the third quarter of 2021, accessable through the World Trade database, allow us to document the current status of global trade in light of the main threats which the world economy is facing.
The latest available data signal that, by the summer, international trade has been expanding at a slower pace than it had been doing until the second quarter of 2021. The graph below illustrates this trend, comparing the historical series of world demand in quantity, i.e. net of nominal price changes, drawn up by the CPB|Economic Policy Analysis institute (updated to July 2021) and that available on ExportPlanning.
Fig.1 - World demand in quantity
(values at constant prices, 3-month moving average)
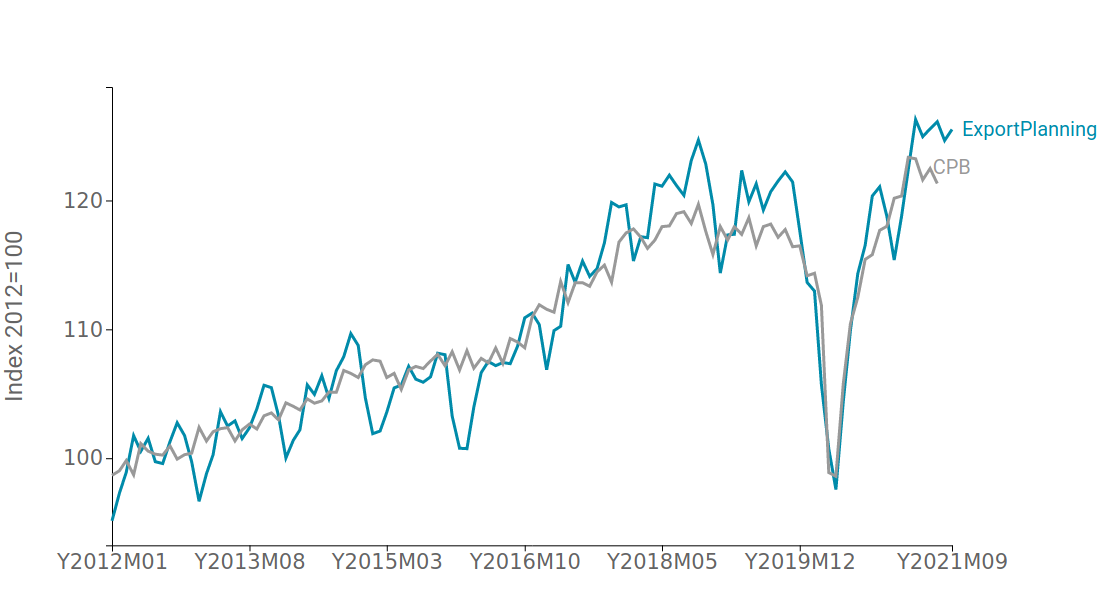
Source: ExportPlanning
Looking at the chart it is clear that, after the V-shaped recovery that followed the last spring's slump, world trade in goods has started to slow down and is gradually converging towards a stabilisation of its growth pace. The same observation emerges from both series, despite some methodological differences in the two measures, thus ensuring the reliability of the results obtained.
In this context, the comparison with the pre-crisis figure is particularly significant, as it does not account for the statistical "base effect" of the contraction recorded in Q2 2020. The graph shows the rates of change recorded by global demand in 2021 compared with the corresponding periods in 2019 and 2020.
Fig.2 – World demand in quantity
(y-o-y growth rates on 2019 and 2020)
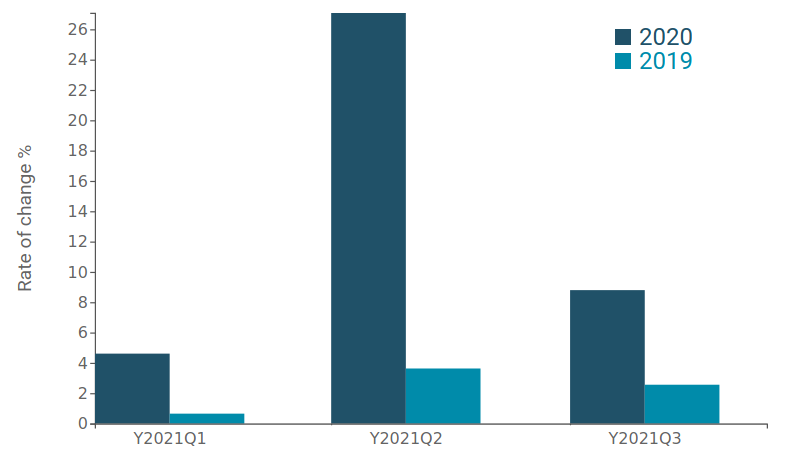
Source: ExportPlanning
If compared to the corresponding period in 2019, global demand for goods registered an acceleration from +0.6% in the first quarter to +3.6% in the second quarter of 2021, before slowing to 2.6% in the July-September period.
This reflects the unfolding problems and weaknesses of global value chains, worsened by the resurgence of the virus in several emerging countries, delays in shipping, and various "bottlenecks".
However, the deceleration of world trade growth is not generalized as different manufacturing industries show heterogeneous recoveries.
The graph below shows the rate of change recorded in the first half and third quarter of 2021 over the corresponding period of 2019 for the main industries of world trade. It is thus possible to highlight those industries whose world trade is increasing (top right of the graph) while distinguishing them from those whose trade volumes are still lower than in 2019 (bottom left). The bisector is also shown, making it possible to identify those industries whose rates of change are decelerating (to the right of the bisector) and those whose rates are accelerating (to the left of the bisector).
Fig.3 - World trade at constant prices (USD 2012) by industry
Source: ExportPlanning
The above chart highlights the industries still lagging behind along with those most significantly exposed to the current supply chain criticalities.
- First, it is possible to have an idea of global commodity trade in quantity, net of the price variations experienced over the recent period. Natural Raw Materials (A1) have not yet recovered from pre-crisis levels. Also, third quarter data is also close to zero. In contrast, world trade in Industrial Raw Materials (A2) has decelerated sharply from a 4.8% growth in the first half of 2021 compared to the same period in 2019, to a much smaller increase of 1.7%;
- Almost all categories of consumer goods experienced a scaling back in the growth pace. That is particularly evident for the Home Goods (E3), whose foreign sales essentially halve the increase recorded in the first half of the year, and for the Health Goods (E4). In addition, the recovery of Fashion Goods (E2), which has been particularly penalized by the current economic situation, continues to be 6% lower than pre-crisis levels.
- For what concerns investment goods, even the automotive sector (Transportation Vehicles- F3 and Components-D3) keeps showing difficulties: in fact, the sector's international trade is in negative territory compared to the pre-crisis figures for the entire period January-September 2021. In sharp contrast, trade in ICT equipment (F1) and the relative supply chain (D1) shows no sign of slowing down.
You may be interested in:

Global trade in footwear machinery: China dominates, Italy leads the way in premium technology
Published by Mauro Badanelli. .
Industrial equipment Conjuncture Foreign markets International marketingThe footwear machinery industry represents one of the pillars of manufacturing innovation in the fashion sector. In an increasingly competitive environment, characterized by global markets, growing }... [ Read all ]

World Trade Trends: International Trade Results in Q2 2026 (Preliminary Estimates)
Published by Marcello Antonioni. .
Home items Fashion Food&Beverage Metal industry Intermediate goods Electronics Chemicals Industrial equipment Conjuncture Automotive Global demand Industries Global economic trendsStrengthening dynamics, driven by AI applications, and the green and digital transitions [ Read all ]

Blue jeans, shifting geographies: the challenge faced by new manufacturing Countries to China and Bangladesh
Published by Mauro Badanelli. .
Fashion Export Foreign markets International marketingBlue jeans: an iconic fashion product Blue jeans are one of the iconic products of the apparel industry, with a well-established presence in markets around the world and demand spanning generat}... [ Read all ]