World Trade Cyclical Review: A Focus on Industries
Sector-by-sector picture of the world trade slowdown in the first nine months of 2022
Published by Marzia Moccia. .
Conjuncture Export markets Uncertainty Global economic trendsThe availability of the ExportPlanning pre-estimates for the first nine months of 2022 - accessible via the World Trade Datamart - makes it possible to document the cyclical situation of world goods trade, in an international context strongly marked by the uncertainty of the Russian-Ukrainian conflict, increases in commodity prices and significant inflationary pressures.
As already reported in the article "Even in Q3 2022 the phase of uncertainty in international trade continued", world trade is giving way to a gradual slowdown in the pace of expansion of recent months. The graph below shows the monthly series of world trade in manufactured goods in quantity, comparing data collected and systematised by ExportPlanning with that of the Central Planning Bureau, an institute that in turn collects and processes information on international trade in goods.
Fig.1 - World trade in quantity
(CPB vs ExportPlanning, three-term moving average)
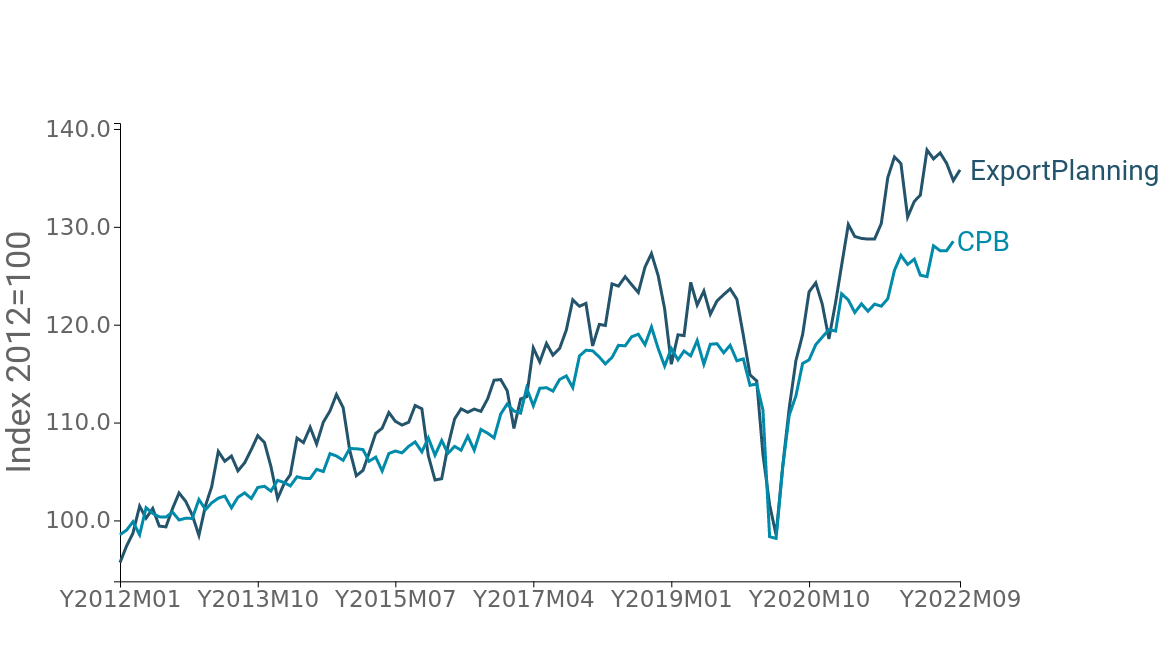
Source: ExportPlanning.
Both series make it possible to highlight how world trade in goods, although now at levels well above - at constant prices - pre-pandemic levels, since the most recent months seems to be progressively converging towards a phase of relative trade stabilisation. Overall, the latest ExportPlanning estimates show an increase in quantity of 6% compared to the same period last year. However, this result can be attributed to a more positive first half of the year, which partly drives the overall increase for the period, alongside evidence of a more marked deceleration from the third quarter onwards.
Also confirming the signs of a slowdown in international trade are the findings of the global manufacturing Purchasing Managers Index, a 'real-time' indicator of economic performance, which summarises the outlook for industrial activity levels based on companies' purchasing declarations. The indicator shows signs of a slowdown for all major economies, with the world aggregate hovering below the neutrality threshold of 50. In particular, both China and Europe have been below this threshold since early summer, while the US has only been below it since the most recent month.
Fig.2 - Purchasing Managers Index - Manufacture
(the grey line indicates the neutrality threshold of 50)
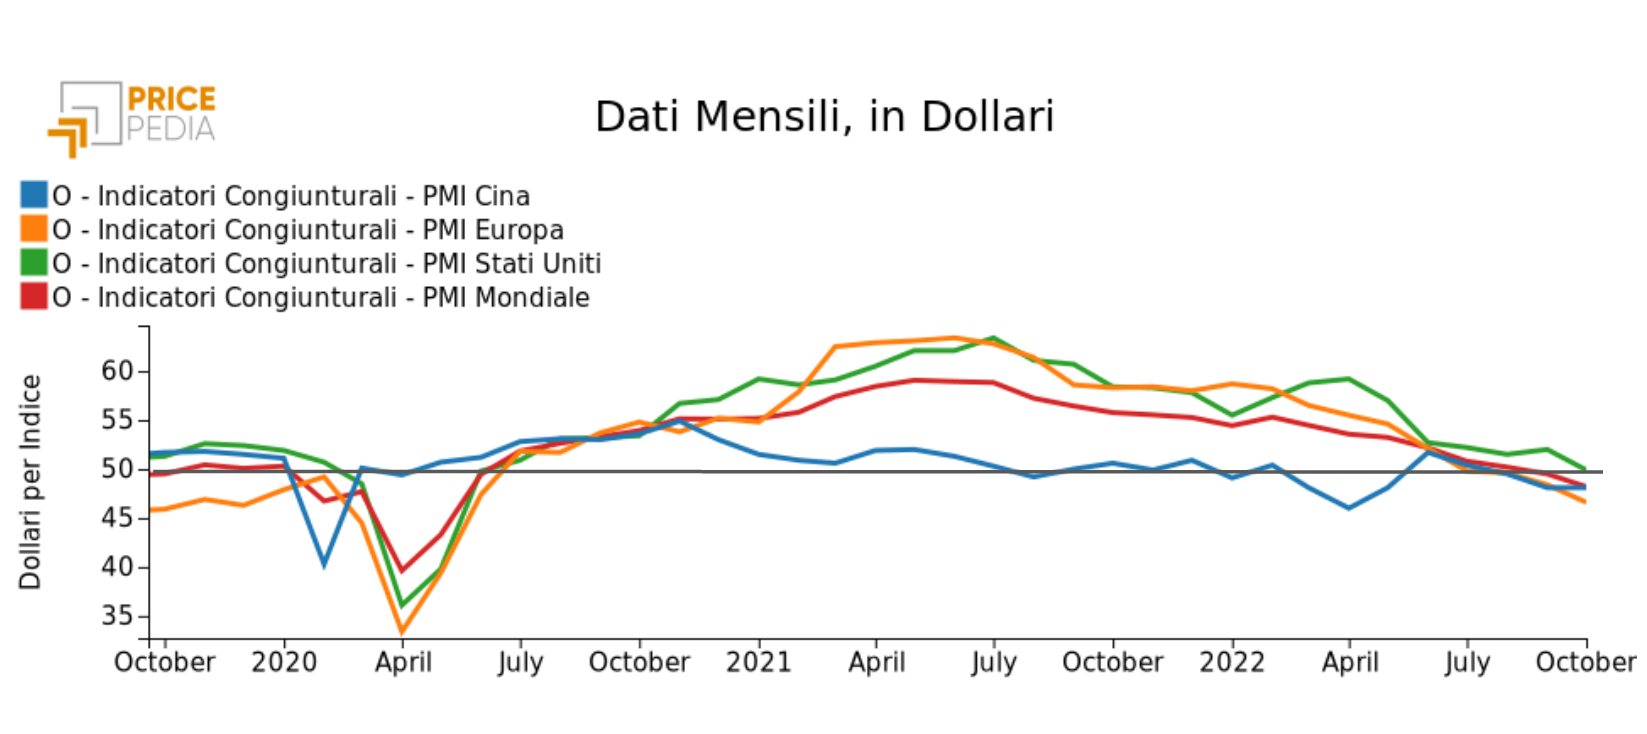
Source:ExportPlanning.
Particularly significant is the New Export Orders component of the Global Manufacturing PMI, which is more closely linked to the dynamics of global trade in manufactured goods, which is also trending below that of the aggregate index. The indicator, in fact, registers values below 50, signalling how new orders from abroad received by companies around the world have entered a deceleration phase.
Fig.3 - Global PMI e New Export Orders
(the grey line indicates the neutrality threshold of 50)
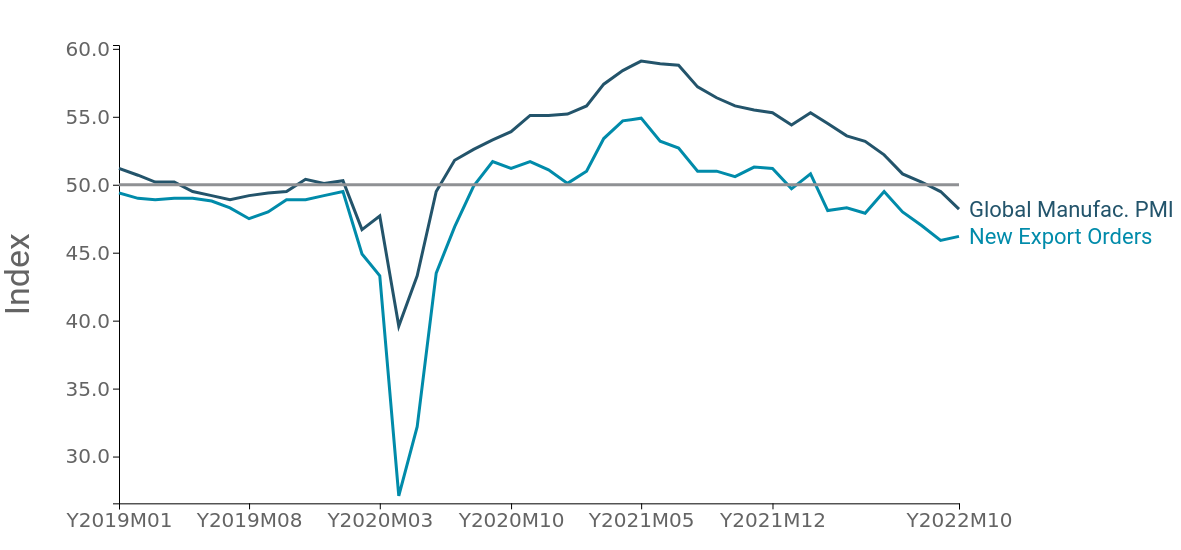
Source: ExportPlanning.
World trade slowdown: the sectoral profile
In order to break down the picture of the slowdown in sectoral terms, the graph below positions on the x-axis the change a recorded by the main industries driving world trade in the six months of 2022, while the y-axis shows the trend change recorded in the third quarter of 2022 compared to the corresponding period of 2021. Through this representation, it is possible to distinguish in the upper left-hand section of the graph those sectors that have accelerated, and in the lower right-hand section those that instead appear to be experiencing a slowdown in the pace of growth.
Fig.4 – International Trade at constant prices: driving and slowing sectors
Positioning the mouse over the circle identifying an industry displays a table summarising the data for the selected sector
Source: ExportPlanning - Go World Trada Datamart
The graphical representation shown at constant prices, i.e. net of exchange rate and price changes, makes it possible to highlight several particularly interesting aspects of the current economic phase.
Firstly, the slowdown that is affecting several categories of intermediate goods appears particularly significant: the chemical (B5), paper and wood (B3) and mineral and metal intermediate goods (B4 and B6) industries, whose growth rates appear to be well below those recorded in the first six months of the year.
On the consumer goods front, those industries that experienced strong growth during the pandemic period, first and foremost Health Products (E4), but also Home System (E3) and Agro-Food (E0), are slowing down, and may now be moving towards a normalisation of their pace of expansion. In this cluster we also find ICT Equipment and Tools (F1), the only capital goods industry to lie below the yellow bisector that divides the accelerating and slowing sectors.
The Automotive (F3 and D3) and Personal Goods (E2) industries held up better, mainly because the recovery of what was lost in 2020 in these segments was more gradual and progressive.
You may be interested in:

IMF WEO Update July 2026: a (precarious) balance between war and technology
Published by Alba Di Rosa. .
Macroeconomic analysis Asia Emerging markets United States of America Uncertainty IMF Eurozone Global economic trendsPer il 2026 il Fondo ha rivisto lievemente al ribasso le stime di crescita del PIL mondiale, ora previsto al +3% [ Read all ]

US Trade Deficit Put to the Test by Tariffs: Evidence from First-Half 2026 Data
Published by Marzia Moccia. .
Slowdown Conjuncture United States of America Uncertainty Trade war Foreign market analysisAmid uncertainty that has now become the new normal, international geopolitical tensions, and the reshaping of the rules governing global trade, the United States undoubtedly remains a key focus of }... [ Read all ]

Plastics processing machinery: what are the main markets and how is the competitive landscape evolving?
Published by Mauro Badanelli. .
Industrial equipment Conjuncture Industries International marketingPlastic processing machinery represents one of the most important technological pillars of modern manufacturing supply chains. Through processes such as injection moulding, extrusion, blow moulding }... [ Read all ]