Machinery: weak and uncertain growth profile for EU sales in 2024; which markets have high potential in 2025?
Opportunities from markets undergoing structural growth of imports in the industry
Published by Silvia Brianese. .
Industrial equipment Export markets Foreign markets Uncertainty Foreign market analysis
In 2024, overall stability of EU exports
of Machinery...
Last year, exports of EU companies of machinery1, despite a somewhat disturbed context, showed a moderate growth, with a final result of +1.1 percentage points in euro values, reaching a new absolute high, equal to approximately 133 billion euros, over 24 billion higher than pre-pandemic values).
.. with moderate growth both in euro values
and in the measurement at constant prices
It should also be highlighted that, even net of price and currency dynamics (constant prices2), last year EU exports of machinery were able to confirm a moderately positive dynamic (+1.5 percentage points compared to 2023). Also in this case, world trade in the industry, measured at constant prices, reached a new high, almost 9 percentage points higher than pre-pandemic levels.
The first quarter of the year also confirmed an overall picture of weak growth in EU exports of Machinery
The quarterly evolution of EU exports of machinery (see the graph below) highlights a moderate growth profile, with a first quarter of 2025 increasing Year-over-Year by about 2 percentage points in euro values.
The 2024 performance of EU exports of machinery was however quite uneven at sectoral level
EU Exports of Machinery
| Values 2024 |
% changes at current prices |
% changes at constant prices |
|||
| Sector | (Bn €) | 2024/'23 | 2024/'19 | 2024/'23 | 2024/'19 |
| Semiconductor manufacturing Machinery | 22.7 | + 7.9 | +106.1 | + 7.8 | +99.4 |
|---|---|---|---|---|---|
| Food Machinery | 17.9 | + 2.1 | +18.5 | - 0.1 | - 2.6 |
| Metal processing Machinery | 16.1 | - 2.9 | + 0.4 | - 1.8 | - 6.2 |
| Packaging Machines | 14.5 | + 7.0 | +17.8 | + 5.1 | + 5.9 |
| Extrusion Machinery | 8.4 | - 4.7 | +16.3 | + 0.9 | + 5.4 |
| Machine Tools for hard materials | 6.5 | - 8.0 | + 2.8 | - 1.5 | -13.1 |
| Textile Machinery | 6.1 | -16.2 | -11.1 | -14.1 | -20.3 |
| Metalworking Machine Tools | 4.9 | + 2.6 | +16.6 | + 2.9 | + 3.1 |
| Paper-making Machinery | 4.2 | - 9.1 | +18.2 | -10.8 | + 7.4 |
| Printing Machines | 2.8 | -11.1 | - 8.2 | - 2.9 | -33.6 |
| Other special purpose Machinery | 29.1 | + 6.4 | +24.8 | + 5.6 | +12.0 |
| TOTAL | 132.8 | + 1.1 | +22.2 | + 1.5 | + 8.6 |
Source: ExportPlanning-World Trade Datamart
In particular, the driving role of EU exports of semiconductor manufacturing machines was confirmed (up by around 8 percentage points both in euro values and at constant prices, at levels well above pre-pandemic levels).
It is also worth highlighting the positive performance of EU sales of packaging machines (+7% last year in euro values, +5.7% in constant prices), metalworking machine tools (+2.6% last year in euro values, +2.9% in constant prices) and other special-purpose machinery (+6.4% in euro values, +5.6% in constant prices), in addition to the stability of sales EU food machinery (+2.1% in euro, at levels well above pre-pandemic levels).
On the other hand, there are negative performances in EU sales of textile machinery (-16.2% compared to 2023 in euro, -14.1% at constant prices), printing machines (-11.1% in euro), paper-making machinery (-9% in euro), machine tools for hard materials (-8% in euro values) and extrusion machinery (-4.9% in euro values).
In addition to the heterogeneous picture at a sectoral level,
EU exports of Machinery show negative performances
in several relevant markets
The geographical profile of EU exports of machinery appears to be quite heterogeneous. Proof of this is the fact that at the 2024 final balance, several relevant markets show significantly declining results and even lower than pre-pandemic ones; above all Taiwan (-1.7 billion euros compared to 2023, -2.8 billion euros compared to 2019), Russia (-601 million euros compared to 2023, -3.1 billion euros compared to 2019), Pakistan (-227 million euros compared to 2019), Bangladesh (-187 million euros compared to 2019), Poland (-164 million euros compared to 2019).
Machinery Markets in growth phase: some case studies
Similarly to what has been observed for consumer goods3, also in the field of investment goods — and in particular for the Machinery industry — it is possible to identify markets with high potential for the export of specific product categories.
The high level of uncertainty characterizing the current economic and political scenario makes it increasingly necessary to adopt market diversification strategies for exporters, in order to mitigate commercial risks for businesses. In this context, the use of machine learning models applied to international trade data makes it possible to identify countries where imports of certain products are experiencing a phase of structural growth.
The table below shows the number of products experiencing import growth for each of the countries considered, broken down by the main sectors of Machinery.
Number of products classified according to the Harmonized System (HS)
identified, for each country, as experiencing import growth
| M. for metalworking | Machine tools for metals | Textile machinery | TOTAL | |
| Cote d'Ivoire | 2 | 7 | 7 | 16 |
|---|---|---|---|---|
| Azerbaijan | 1 | 4 | 8 | 13 |
| Algeria | 1 | 3 | 3 | 7 |
| India | 2 | 2 | 1 | 4 |
| Brazil | 1 | 1 | 2 | 4 |
Source: StudiaBo elaborations on ExportPlanning database
Note: the table does not include all sectors of Instrumental Mechanics, but only those with the highest number of products experiencing import growth
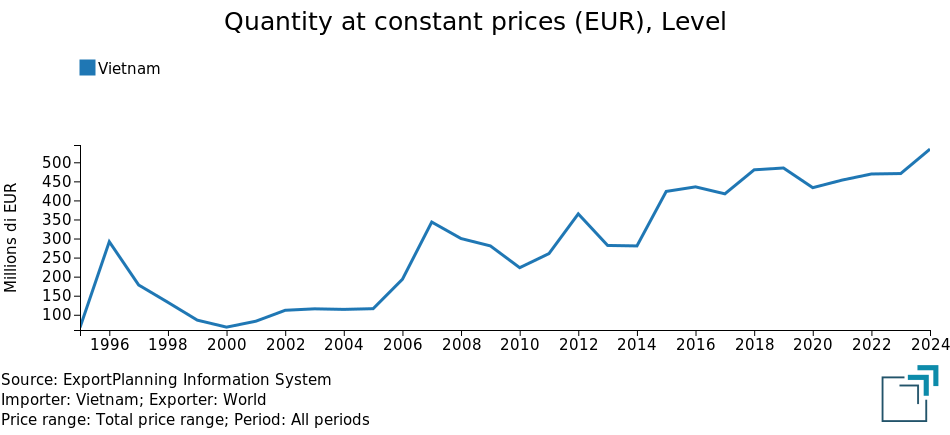
It is worth noting that among the markets characterized by structural import growth, Vietnam stands out in the food machinery sector and Chile in the textile machinery sector. In both cases, a positive trend can be observed in imports of cream separators in the case of Vietnam, and in imports of machines for spinning, stretching, or cutting synthetic textile materials in Chile.
Particularly interesting is also the case of Cote d'Ivoire, currently considered one of the most stable economies in Sub-Saharan Africa. This country is undergoing a phase of sustained growth and features a solid political-institutional framework, as well as an efficient system of logistical infrastructure. These factors contribute to making the operational environment more favorable for businesses, opening up opportunities also for instrumental mechanics.
Finally, the results of the table are further confirmed by the analysis of historical import series for each Machinery sector, with a focus on the countries showing the highest number of products in a growth phase.
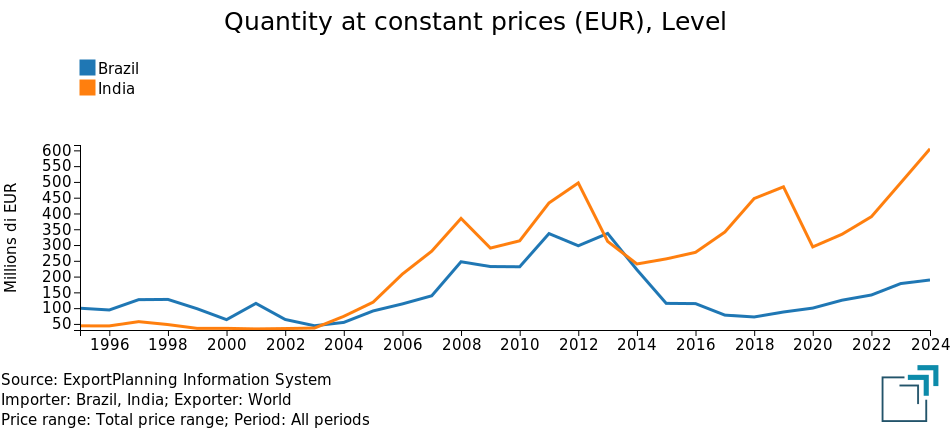
In particular, Brazil and India emerge as growing markets for imports of metalworking machinery, especially regarding numerically controlled bending presses.
Metalworking machinery: imports of Brazil and India
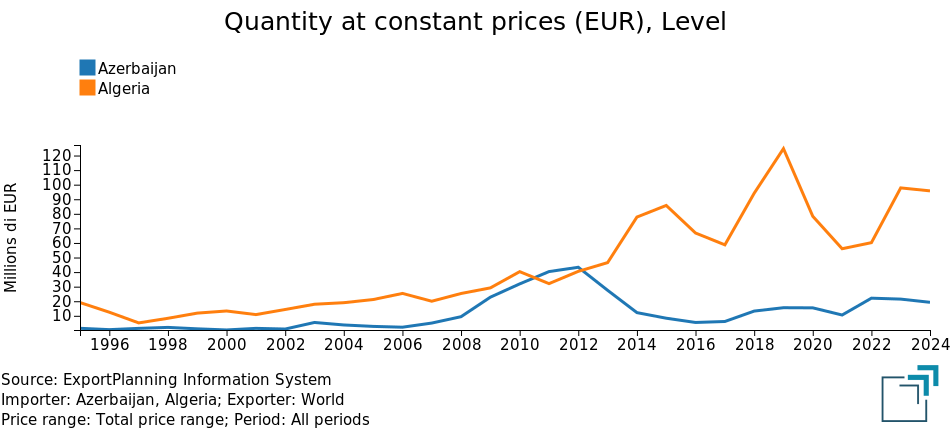
As for machine tools for metals, in addition to Brazil and India, Azerbaijan and Algeria also emerge as markets with the highest number of products experiencing import growth, with increasing demand especially for laser-operated machine tools and fixed-position machines for metalworking.
Machine tools for metals: imports of Azerbaijan and Algeria
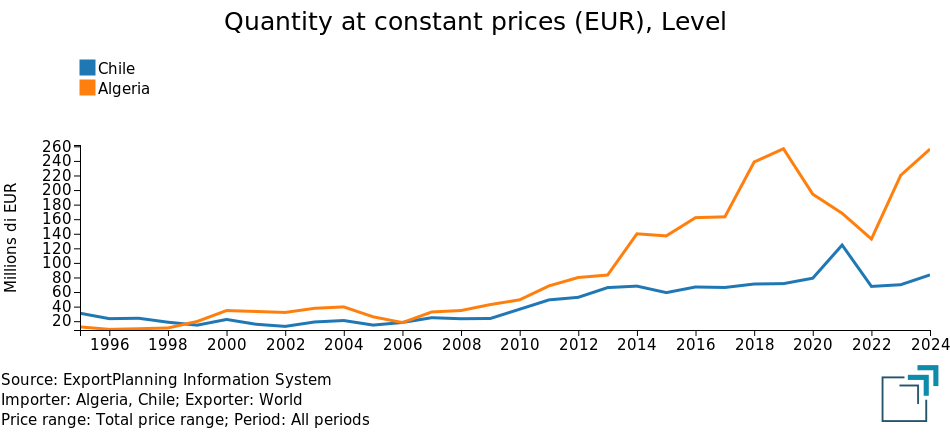
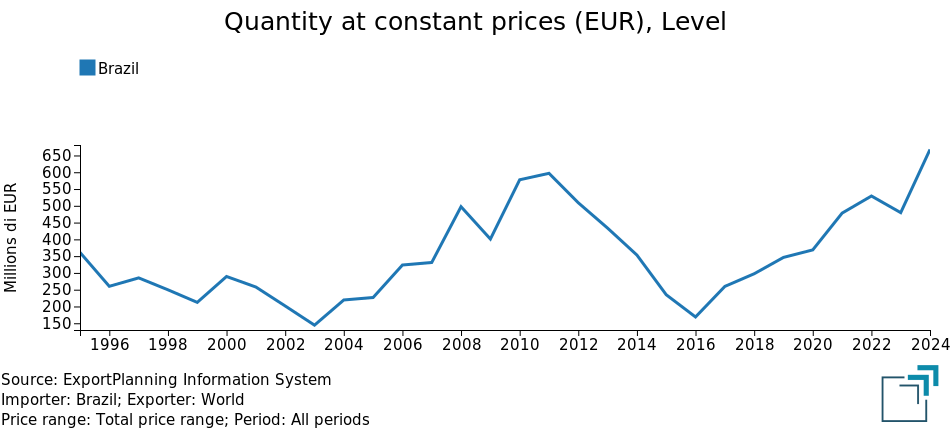
In the textile machinery sector, Brazil and Algeria stand out as emerging markets in terms of imports of laundry machines (particularly those with a unit capacity greater than 10 kg), as well as machines and equipment for drying yarns or fabrics, and knitting looms. Chile also shows significant growth in textile machinery imports, especially dryers and other drying machines, laundry machines, and looms for producing tulle, lace, and embroidery.
Textile machinery: imports of Algeria and Chile
Textile machinery: imports of Brazil
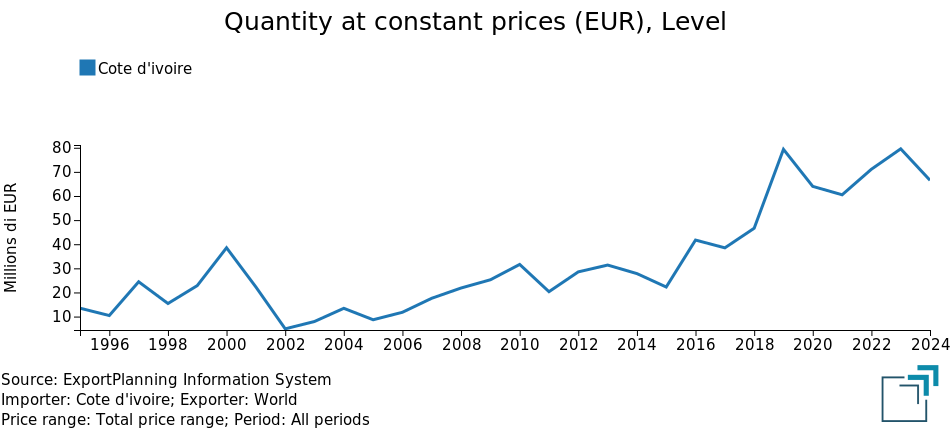
Finally, in the food machinery sector, the markets registering the highest number of products in a phase of structural import growth are Cote d'Ivoire and Vietnam, although the total number of growing products remains fairly limited. Among the main expanding categories are cream separators, industrial meat processing equipment, as well as presses, crushers, and similar tools for the production of wine, cider, and fruit juices.
Food machinery: imports of Cote d'Ivoire
Food machinery: imports of Vietnam
Conclusions
As highlighted by recent cyclical trends, total exports of Machinery from EU countries have shown moderate growth. However, the picture remains uneven at both the geographical and product level, with significant contractions in several key sectors and markets, in some cases falling below even pre-pandemic levels.
In this context, the diversification of export destination markets remains a strategic priority, including for the Machinery industry. The use of machine learning techniques applied to international trade data allows for more precise identification of markets undergoing a phase of structural import growth, opening new development opportunities.
The proposed analysis therefore serves as an operational tool to support exporters, useful both for consolidating their presence in existing markets and for exploring new high-potential geographies in the Machinery industry.
1) For a list of the sectors analysed, please refer to the relevant industry description.
2) The measure Quantities at constant prices (Q) includes a deflation operation, in which the historical series of monetary values (V) has been transformed into an analogous series of values expressed at constant prices, with a reference to a given year, known as the base year. For a description of the methodology applied, please refer to World Trade Database: Methodological Note.
3) See the following reference articles:
- Household Products: after a recovery in 2024, which high-potential destinations for sectoral exporters?
- Fashion Products: after the last two years of high uncertainty, which destinations have high potential for 2025?
- Packaged food and beverage: after a positive acceleration in 2024, which markets have high potential in 2025?
You may be interested in:

January 2026: the latest data on global trade in goods
Published by Marzia Moccia. .
Slowdown Exchange rate Conjuncture Dollar Euro Foreign markets Uncertainty Global economic trendsThe availability in the ExportPlanning Information System of global trade data for January makes it possible to update the short-term outlook on the most recent dynamics of world trade in goods, wit}... [ Read all ]

B-READY 2025: the World Bank’s new compass for economic development
Published by Veronica Campostrini. .
Macroeconomic analysis Foreign markets Economic policy Central banks Foreign market analysisWith the publication of the Business Ready 2025 report, the World Bank introduces the new B-READY (Business Ready) index, intended to permanently replace the previous Doing Business, which was suspend}... [ Read all ]
Machinery for nonwovens production facing the sustainability challenge
Published by Mauro Badanelli. .
Importexport Industrial equipment International marketing International marketingOver the course of the 21st century, the nonwovens sector has experienced solid growth in both production and exports. The driver of this development lies in the features of nonwovens, which have en}... [ Read all ]