Beyond GDP: inequality and economic growth
Published by Veronica Campostrini. .
Internationalisation Foreign markets Foreign market analysisFor decades, Gross Domestic Product has been the benchmark for measuring a country’s economic growth. A simple, immediate indicator that summarizes the monetary value of goods and services produced in a single figure. But is it really enough to understand whether an economy is growing in a healthy, balanced, and inclusive way?
Behind the aggregate GDP figure, in fact, can lie deep social inequalities, latent tensions, and structural imbalances that undermine the stability and sustainability of development. It is therefore essential to understand how wealth is distributed among individuals in a country.
GDP and Inequality
This broader perspective takes shape through an analysis that combines per capita GDP with a second crucial indicator: the degree of inequality in income distribution. The idea is simple: two countries with the same average income may offer vastly different living conditions depending on how that wealth is distributed across the population.
This is not merely an ethical issue. Economic theory shows how wealth concentration affects social cohesion, reduces domestic consumption, weakens political stability, and discourages investment. In short, unequal growth tends to be fragile growth. This thesis is supported, among others, by a study by S. Aiyar and C. Ebeke for the International Monetary Fund (“Inequality of Opportunity, Inequality of Income and Economic Growth”, IMF Working Papers, 2019), which finds that persistently high levels of income inequality tend to slow economic growth—especially in emerging markets—while more equitable distribution can strengthen economic activity. Joseph Stiglitz, Nobel laureate in economics, also emphasizes in his book The Price of Inequality that extreme inequality not only undermines social justice but also poses a serious obstacle to economic stability and collective progress.
The Gini Index: Understanding Inequality
A well-established tool to measure inequality is the Gini index. This indicator quantifies the deviation of a country’s actual income distribution from a perfectly equal distribution. It ranges from 0 (perfect equality) to 100 (maximum inequality). In practice, however, observed values across countries tend to fall between 24 and 63. For example, the World Bank considers a country to be highly unequal if its Gini index exceeds 40.
The index has several strengths: it is comparable across countries, independent of size, and consistent with redistributive principles. Nonetheless, it is not without limitations. It may produce ambiguous results, is sensitive to data quality, and does not always capture long-term dynamics. The index does not provide information on how income is distributed across specific population groups, but it offers a comprehensive snapshot of overall inequality and remains a good compromise between simplicity and analytical depth.
Beyond income, a country’s institutional context is another decisive factor. Economic literature distinguishes between inclusive institutions, which promote broad participation and equity, and extractive institutions, which concentrate power and resources in the hands of a few.
The former foster durable and solid growth, capable of generating development for large segments of the population. The latter—although sometimes associated with rapid economic booms—tend to generate deep inequalities and structural instability.
Understanding a country's institutional framework is therefore essential for assessing the sustainability of its development over time.
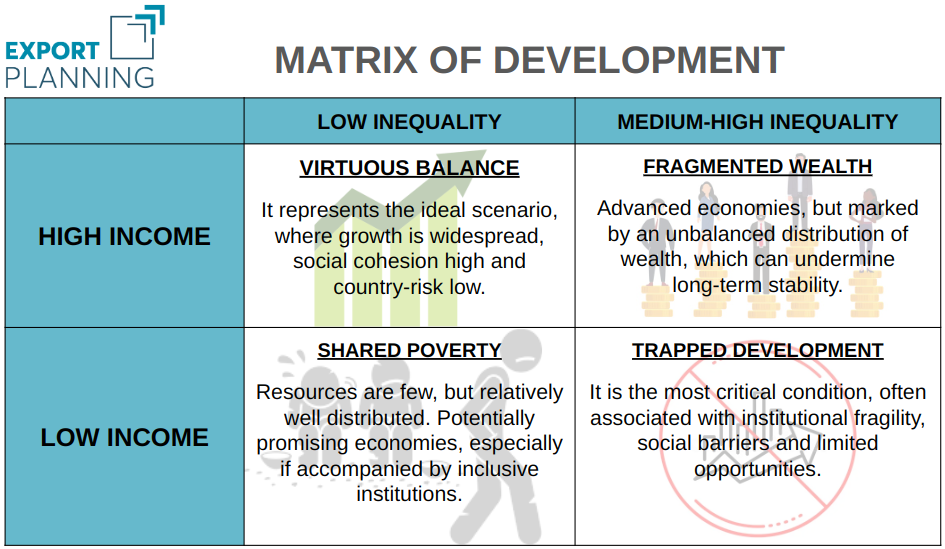
The Development Matrix: A Tool for Orientation
To synthesize these concepts and offer concrete support for strategic decisions, ExportPlanning has developed a Development Matrix. This model combines two key variables — per capita income and the Gini index — classifying countries into four distinct scenarios.
To build the matrix, countries were classified based on well-defined quantitative thresholds, allowing for clear and replicable segmentation:
- Income Inequality (Gini Index):
- Low inequality: between 20 and 30
- High inequality: between 31 and 65
- Per Capita Income (source: World Bank – Atlas method):
- Low income: ≤ USD 14,005
- High income: > USD 14,005
This classification system allows for a visual mapping of the world's economies, highlighting deep structural differences that GDP alone cannot reveal.
Source: ExportPlanning elaborations
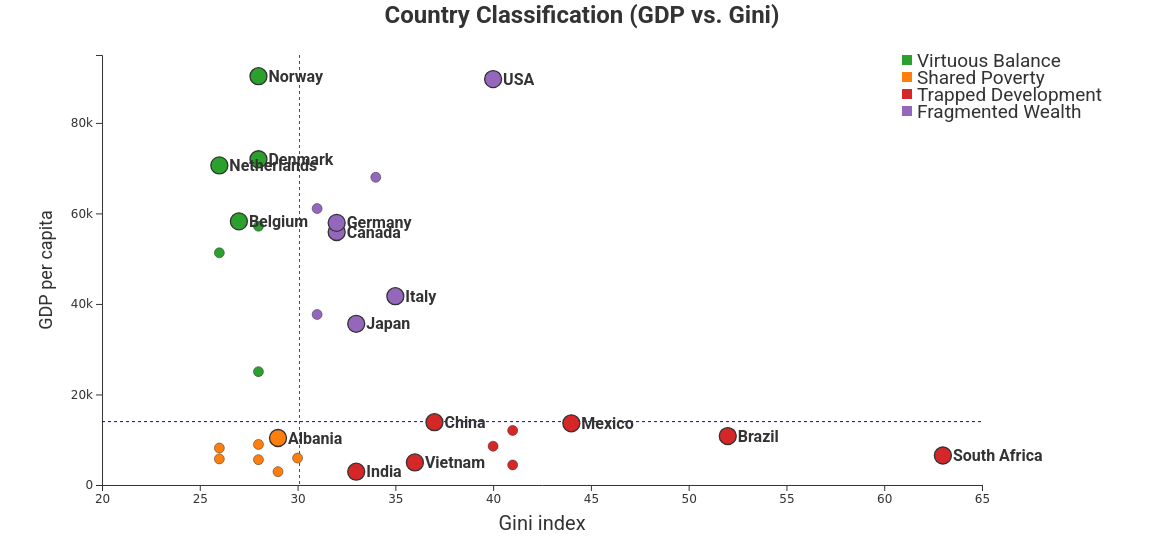
Looking Beyond GDP: A Competitive Advantage
Applying this matrix to a broad range of countries results in a visual map that allows users to grasp structural differences across economies at a glance.
Source: ExportPlanning elaborations
It is a valuable tool for businesses aiming to internationalize, for investors seeking stable markets, and for institutions designing cooperation and development policies.
In a world where growth is increasingly interconnected — and often unequal — knowing how much a country produces is not enough.
One must also understand how that wealth is distributed, and to whom.
This perspective makes it possible to quickly identify diverse development paths. Northern European countries such as Norway, Denmark, and Belgium stand out as examples of “Virtuous Balance”, with high per capita GDP and relatively equitable wealth distribution: solid economies offering both stability and inclusion. At the opposite end, countries like Brazil, Mexico, and South Africa fall into the category of “Trapped Development”, with low income levels and stark internal inequalities — contexts where economic growth does not translate into widespread well-being and where social and economic fragility are more pronounced.
Italy, meanwhile, is positioned in the “Fragmented Wealth” category, with a relatively high per capita GDP but visible signs of inequality. The United States, despite boasting one of the highest average income levels, exhibits a high concentration of wealth, confirming a highly polarized growth model.
In this light, the development matrix (Gini-GDP) not only offers an immediate snapshot of national economic structures but also serves as a strategic tool for evaluating the quality of development in international markets.
Conclusion: Toward a More Complete Paradigm
Economic and institutional analysis of a country can no longer overlook a multidimensional view of development. GDP remains a fundamental indicator, but it is not sufficient on its own. Complementing it with metrics such as income inequality and institutional quality provides a deeper, more realistic, and more useful understanding to guide decision-making.
You may be interested in:

Global trade in nonwovens: an analysis by application sector
Published by Mauro Badanelli. .
Internationalisation Importexport Industries International marketingThe nonwovens sector has experienced strong growth over the past decades, driven by the wide range of applications enabled by the key characteristics of this product: versatility, functionality and co}... [ Read all ]

B-READY 2025: the World Bank’s new compass for economic development
Published by Veronica Campostrini. .
Macroeconomic analysis Foreign markets Economic policy Central banks Foreign market analysisWith the publication of the Business Ready 2025 report, the World Bank introduces the new B-READY (Business Ready) index, intended to permanently replace the previous Doing Business, which was suspend}... [ Read all ]

Decision-Making Under Uncertainty: The Strategic Value of External Data
Published by Marzia Moccia. .
Planning Internationalisation International marketing Internationalisation toolsA company’s performance largely depends on the quality of the decisions it makes, and the quality of decisions depends on the information available. Effective decisions allow the company to move for}... [ Read all ]