The Global Demand Recovery Path
The recovery of world trade, visible from the summer months, marks its best result in September
Published by Marzia Moccia. .
Great Lockdown Conjuncture Global demand Uncertainty Global economic trends
Foreign trade declaration data of the main world economies up-to-date as of September 2020, available in ExportPlanning Quarterly International Trade datamart, allow to take stock of the economic conjuncture of international trade.
After the marked contraction recorded in the spring months, the recovery path of international trade, started in June, has never stopped for the moment. The following graph shows the year-over-year rate of change (compared to the corresponding month of the previous year) of world demand for goods in dollars, by comparing the information processed by the CPB|Economic Policy Analysis institute with those available on ExportPlanning.
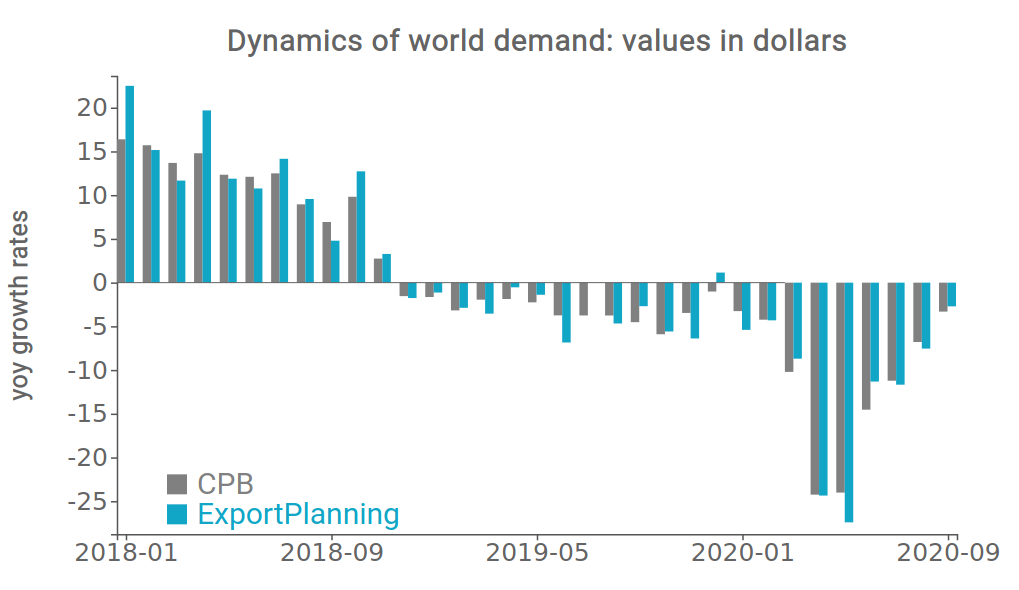
Source: ExportPlanning
Although CPB and ExportPlanning data are the result of a different approach[1], the alignment of the dynamics of the two series certifies the degree of reliability and consistency of the two results.
After the y-o-y 25% drop in the months of April-May, the recovery in world trade flows visible from the summer months has shown the best result in September: the decline in world demand - measured in current dollars - is "only" 2.7 percentage points lower than in September 2019 .
In order to extract the only component that measures the y-o-y variation in volume of international trade, net of the nominal effects linked to price and exchange rate variations, it is particularly interesting to also report the dynamics of world demand at constant prices.
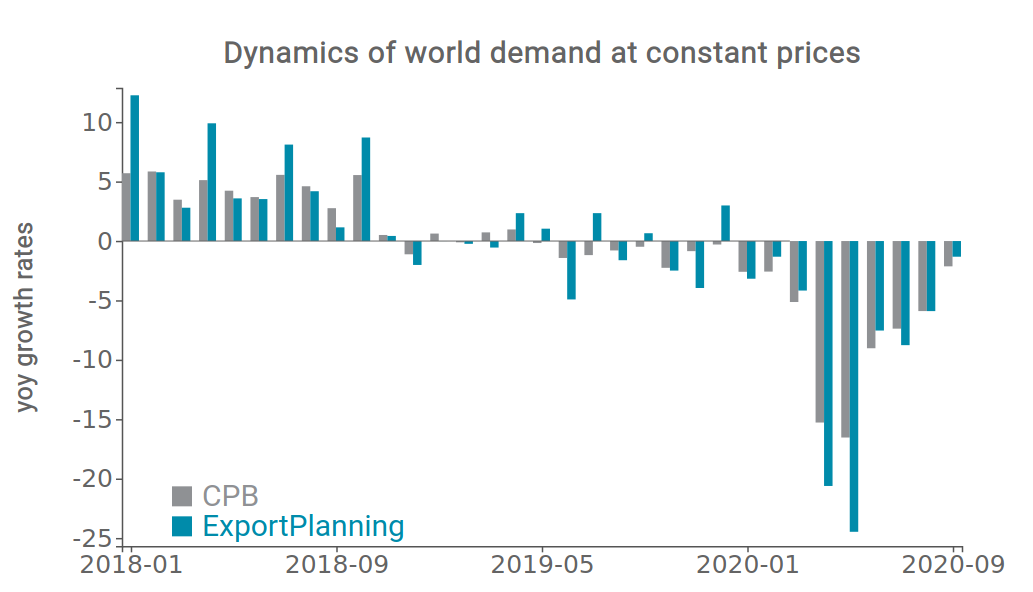
Source: ExportPlanning
Also in this case both CPB and EP measurements are very similar, although they are the result of different methodologies[2].
In terms of quantity, the result is a fall in world demand between -1.5% (according to EP) and -2% (according to CPB) in September. The result shows that the gap with pre-Covid levels of global demand for goods has narrowed significantly since the beginning of the summer.
The overall picture that emerges in the first nine months of the year is a drop between -7.5% and -8.5% at constant prices, limiting the fall in world trade to a single digit rate, unlike what was estimated by several forecasters at the beginning of the Covid crisis.
The extent to which the recovery trend shown can consolidated in the last quarter of the year depends closely on the effects of the second wave of infections and on the related containment measures adopted in recent weeks. Awaiting the release of official statistics on international trade data, one of the "real-time" indicators of economic performance is the Purchasing Managers' Index (PMI), which summarizes the outlook for industrial activity levels on the basis of companies' purchase expectations. The graph below reports the last update of the PMI Index relative to the manufacturing industry.
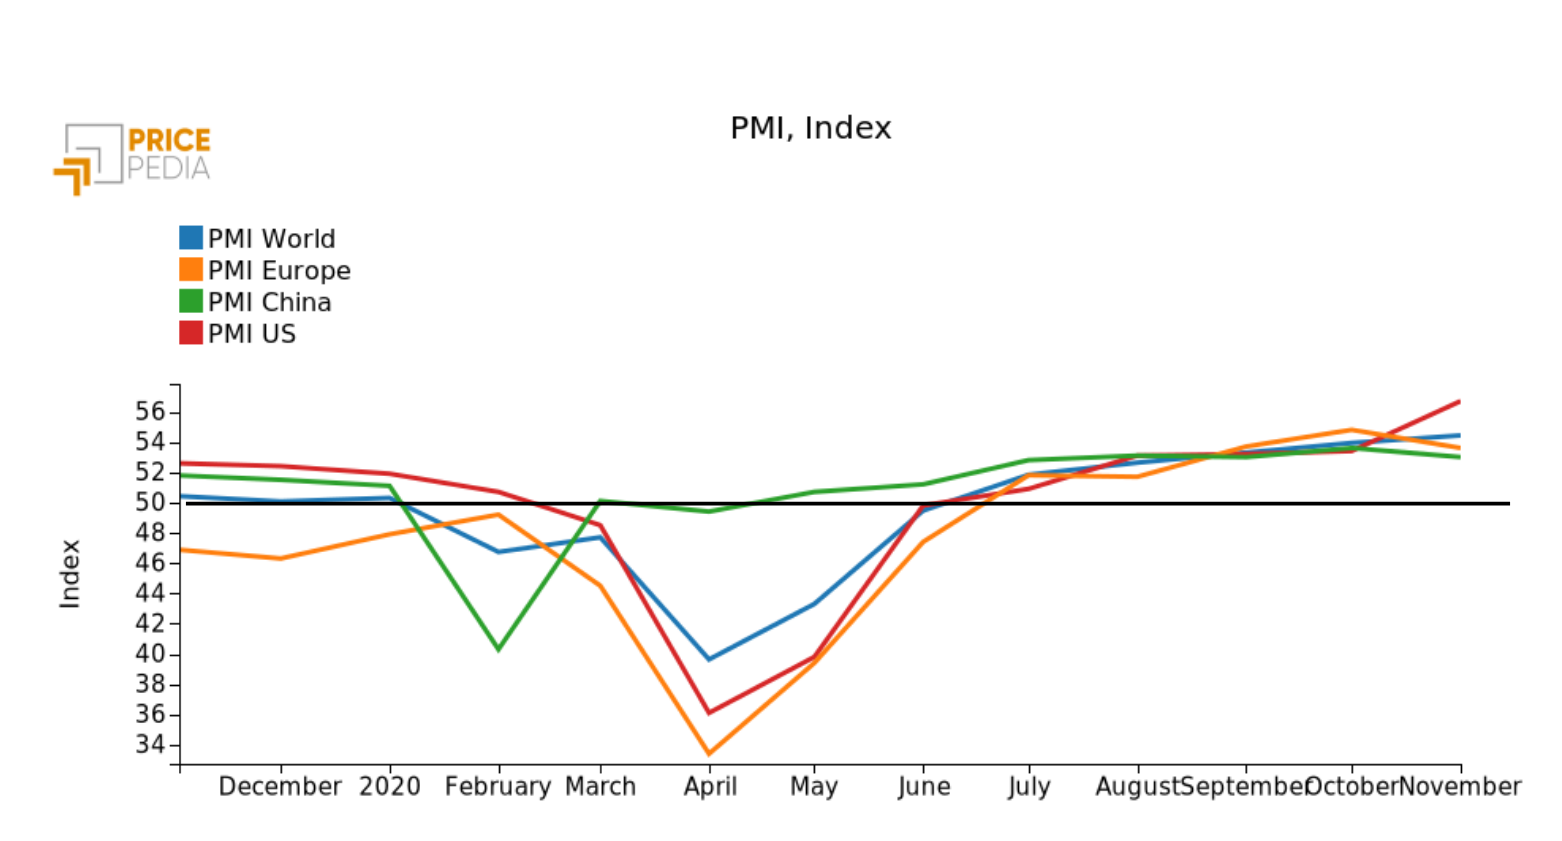
Source: Pricepedia
From June onwards, the PMI Index has remained steadily above the critical threshold of 50, indicating expectations of expansion of production activity levels for all major countries. The result shows a relative resilience of the manufacturing industry even in the most recent months of October and November, marked by the recovery of the epidemic in the West. It is no coincidence that the index lost some ground in November for the Eurozone.
While the latest available data indicate a resilient manufacturing industry over the past few months, it should be noted that the same cannot be said for the services sector, which is facing, on the contrary, a downward trend in activity levels.
On the side of world demand for goods, the end of the year is expected to be less negative than initially assumed; however, the path to recovery of pre-Covid levels is still long and dependent on the evolution of the epidemic, as well as the availability of vaccines on a large scale.
[1] CPB Netherlands Bureau for Economic Policy Analysis aggregates the total import data made available by the statistical offices of the different countries; ExportPlanning considers the declarations made by the companies of the world's major countries at the 6-digit Harmonized System customs code level.
[2] To carry out this deflation there are various methodologies. The CPB deflates a country's total dollar trade with a price index obtained by taking into account the exchange rates of currencies and inflation of the several countries, derived from consumer, wholesale and production price surveys. ExportPlanning uses appropriate price indices obtained using average unit values at the 6-digit Harmonized System single code level.
You may be interested in:

Global trade in footwear machinery: China dominates, Italy leads the way in premium technology
Published by Mauro Badanelli. .
Industrial equipment Conjuncture Foreign markets International marketingThe footwear machinery industry represents one of the pillars of manufacturing innovation in the fashion sector. In an increasingly competitive environment, characterized by global markets, growing }... [ Read all ]

World Trade Trends: International Trade Results in Q2 2026 (Preliminary Estimates)
Published by Marcello Antonioni. .
Home items Fashion Food&Beverage Metal industry Intermediate goods Electronics Chemicals Industrial equipment Conjuncture Automotive Global demand Industries Global economic trendsStrengthening dynamics, driven by AI applications, and the green and digital transitions [ Read all ]

IMF WEO Update July 2026: a (precarious) balance between war and technology
Published by Alba Di Rosa. .
Macroeconomic analysis Asia Emerging markets United States of America Uncertainty IMF Eurozone Global economic trendsPer il 2026 il Fondo ha rivisto lievemente al ribasso le stime di crescita del PIL mondiale, ora previsto al +3% [ Read all ]