Trump and the new tariffs of 2025: the list of exempted products
Published by Simone Zambelli. .
United States of America Trade balance Trade war Market Accessibility
Following the April 2 announcement in which the Trump administration introduced a new executive order on tariffs towards all trading partners, analysts and observers have focused on the possible reactions of the countries involved and the consequences for the global economy.
The markets' response was extremely negative: all global stock exchanges recorded significant declines, as did commodity prices and even gold, traditionally considered a safe haven asset.
The impact of these events was so significant that it overshadowed the detailed analysis of the announced measures, which have so far been little examined in their specific contents.
In particular, the so-called Annex II to the executive order "Regulating Imports with a Reciprocal Tariff to Rectify Trade Practices that Contribute to Large and Persistent Annual United States Goods Trade Deficits” (section 3, paragraph b) seems to be of particular interest. This annex includes a list of over 1,000 products that are exempt from the tariffs introduced on April 2. This article provides an initial examination of these exempt products.
An Overview of the 2025 Tariffs
The infographic shows the evolution of U.S. executive orders in 2025 related to the trade tariffs introduced by the Trump administration, with particular reference to the measures implemented between February and April.
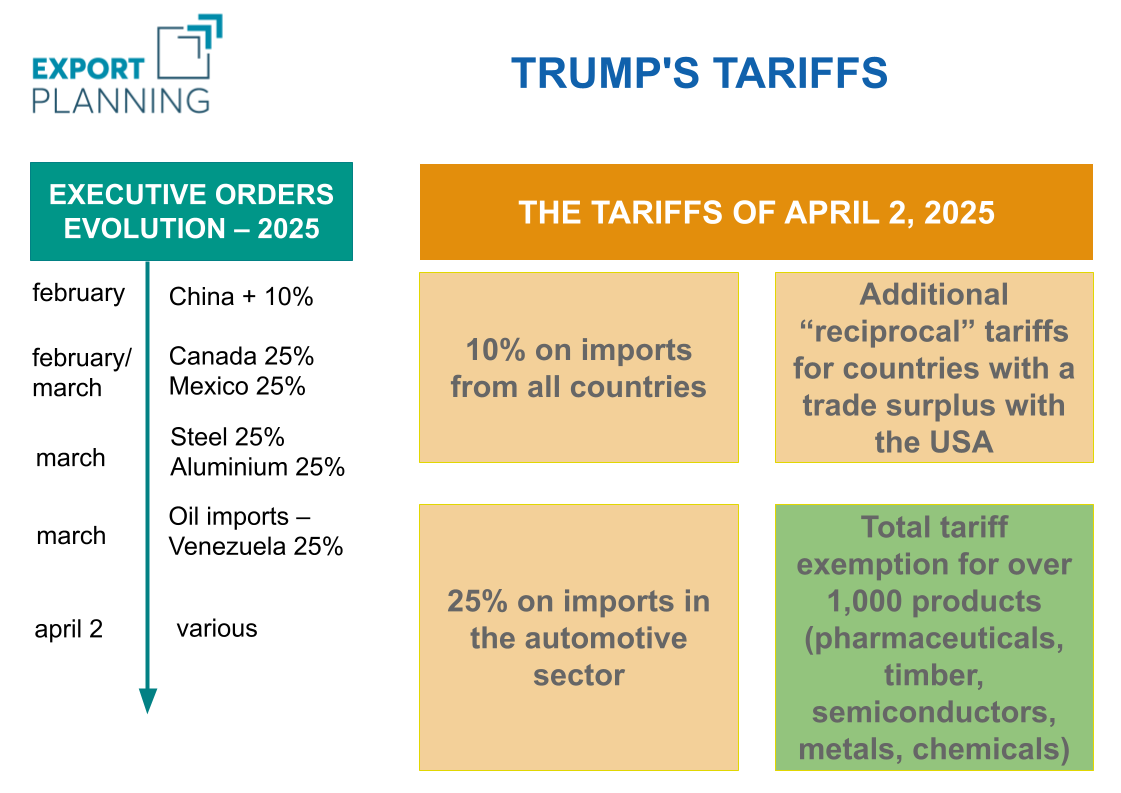
Source: ExportPlanning
The central focus is on the new tariff measures of early 2025, culminating in the package of duties announced on April 2, which marks a particularly aggressive shift in the protectionist policy of the United States. There is a progressive expansion of the sectors and countries involved. In February, targeted tariffs were introduced with ad hoc actions against specific trading partners, with an additional 10% duty on imports from China and 25% on those from Canada and Mexico (however, for the latter two, a series of exemptions apply for products within the USMCA agreement scope under the Rules of Origin).
In March, it was the turn of strategic raw materials, with a 25% tariff introduced on steel and aluminum.
As illustrated in the articles “The steel trade war: from 2018 to the new phase of 2025” and “Effects of trade tariffs on aluminium prices”, this measure caused an increase in steel and aluminum prices in the United States, creating a gap with prices in the rest of the world.
A similar trend was seen for copper: initially, markets anticipated its inclusion in the April 2 tariffs, raising prices at the Chicago Mercantile Exchange (CME). However, once copper's exclusion was confirmed, prices at the CME started to decline, aligning again with the London Metal Exchange (LME).
Also in March, another 25% tariff hit oil imports from Venezuela, signaling a desire for decoupling in both energy and political terms.
Finally, on April 2, the core package of the 2025 tariff strategy was announced, in what the U.S. administration dubbed "Liberation Day."
The executive order introduced a general 10% tariff on all American imports, regardless of origin—an official break from free trade values. The same order also implemented the so-called “reciprocal tariffs,” targeting countries with a large trade surplus with the U.S., including a 20% tariff on the EU.
However, the measure includes a broad exemption for over 1,000 products, such as pharmaceuticals, semiconductors, timber, metals, and chemicals. These exclusions aim to avoid impacts on critical sectors and to limit cost increases for American businesses and consumers.
In the same period, new tariffs on automotive imports also came into effect, with a 25% duty applied not only to finished vehicles but also to imported components. A heavy measure, with potentially disruptive effects on a highly globalized production chain.
Products Exempt from Tariffs
At this point, it is helpful to analyze which sectors benefited most from exemption from the Trump administration’s tariff measures.
To provide a clearer and more structured view of the product composition, we matched the product list with the ExportPlanning sector classification. This makes it easier to interpret the impact of the tariffs.
The following table shows ExportPlanning sectors with the highest number of exempt products, along with the percentage of tariff codes not affected. Sectors are ordered by exemption rate, from highest to lowest.
| ExportPlanning Code | Description | Nr. Exempt Products | Nr. Non-Exempt Products | Share (%) |
|---|---|---|---|---|
| A2.21 | Petroleum products and coal derivatives | 95 | 0 | 100 |
| A2.12 | Copper | 92 | 0 | 100 |
| B3.13 | Wood-based sheets and panels | 196 | 8 | 96 |
| A1.11 | Energy raw materials | 20 | 1 | 95 |
| B3.11 | Sawn wood | 144 | 9 | 94 |
| A1.31 | Raw timber | 78 | 12 | 87 |
| E4.11 | Pharmaceuticals | 113 | 21 | 84 |
| B5.41 | Basic pharmaceutical products | 172 | 68 | 72 |
| A1.22 | Minerals for the chemical industry | 13 | 7 | 65 |
| A1.21 | Metallic minerals | 35 | 25 | 58 |
| A2.16 | Precious metals | 19 | 14 | 58 |
| A2.15 | Nickel and other non-ferrous metals | 44 | 52 | 46 |
| E2.61 | Books and other creative products | 34 | 54 | 39 |
| A1.33 | Natural rubber and other non-wood products | 16 | 26 | 38 |
| B4.83 | Foundry castings | 12 | 20 | 38 |
| A2.14 | Lead, zinc, and tin | 8 | 14 | 36 |
| A2.23 | Basic inorganic chemicals | 91 | 179 | 34 |
| D1.12 | Computer and office machinery parts | 13 | 28 | 32 |
| A2.31 | Plastics in primary forms | 33 | 74 | 31 |
Source: ExportPlanning
What stands out is that some strategic sectors were almost completely excluded from the new measures. In particular, electricity, petroleum products, and copper show full exemption, with 100% of products unaffected. These exclusions suggest a clear intention not to impact critical inputs for U.S. production competitiveness, which are difficult to replace in the short term.
Next come sectors related to wood and energy raw materials, also with very high exemption levels (between 87% and 96%).
The pharmaceutical sector also enjoys significant protection, with 84% of drugs and 72% of basic pharmaceutical products exempted, an indication of strong global supply chain integration, especially with the EU.
Next, we find sectors related to minerals and precious metals, which, while not the most protected, still show significant exemption rates (between 50% and 60%). This suggests a more cautious strategy: on the one hand, acknowledging the importance of these raw materials for national industry, and on the other, still using tariffs to encourage greater production autonomy.
This stands in contrast with the treatment of steel and aluminum, previously mentioned, where full tariffs were imposed to strengthen domestic production. For other materials —such as copper, precious metals, and industrial minerals— the approach has been more restrained.
Overall, the table shows that the April 2 tariff exemptions were not distributed uniformly but followed a selective logic, aimed at safeguarding energy supply and key industrial sectors.
Conclusions
The Trump administration’s trade policy aims to revive domestic U.S. production by using tariffs as a lever to limit imports and rebalance trade relations.
The exclusion of key sectors —such as energy, pharmaceuticals, and copper— shows a selective approach: protecting strategic areas while avoiding damage to essential goods for the economy and competitiveness of U.S. companies.
This mix of protection and flexibility makes the strategy more complex than a simple protectionist closure. However, the measures risk creating instability in global markets, fueling trade tensions, and putting pressure on the current international trade system.
You may be interested in:

Amid tariffs and uncertainty, the downsizing of US imports continues
Published by Alba Di Rosa. .
Dollar United States of America Trade balance Export Trade war Import Foreign market analysisThe US Census Bureau recently released the latest foreign trade data, updated as of February 2026, and now available on the ExportPlanning platform [ Read all ]

US Tariffs: Even More Uncertainty?
Published by Marzia Moccia. .
United States of America Uncertainty Trade war Global economic trends“Tariff is the most beautiful word in the dictionary”, stated Donald Trump during his second campaign for the White House, clearly foreshadowing the central role that tariffs would play in shaping t}... [ Read all ]
EU–China: the evolution of the trade relationship and new sectoral balances
Published by Veronica Campostrini. .
Importexport Trade balance Foreign markets Foreign market analysisThe evolution of the trade balance in goods between the European Union and China today represents one of the most relevant lenses through which to understand the new asymmetries of international trade}... [ Read all ]