Trump 2.0: How Effective Is U.S. Tariff Policy?
Preliminary Evidence on the Stated Economic Objectives
Published by Marzia Moccia. .
Dollar United States of America International marketing
“Tariff is the most beautiful word in the dictionary” argued President Trump during his second run for the White House, clearly signaling the central role that tariffs would play as the cornerstone of the new administration’s foreign policy strategy.
Expectations have certainly not been disappointed: from the very start of his term, President Trump forcefully relaunched a tighter protectionist policy, pursuing multiple objectives at the same time—economic, political-negotiating, and the redefinition of bilateral foreign relations.
In taking stock of the first nine months of Trump’s second term—and of the major return of stars-and-stripes protectionism—it is useful to assess the effectiveness of these policies, especially in relation to the stated economic objectives, which can be summarized in two main points:
- increase in federal revenues to address the rise in the public deficit caused by the Big Beautiful Bill, passed last July, and by the planned tax cuts;
- recovery of the U.S. manufacturing production capacity and a rebalancing of the trade deficit, by improving the price competitiveness of domestically produced goods in order to limit—if not reverse—the process of industrial decline.
To this end, the release by ExportPlanning of foreign trade information updated to the third quarter of 2025 enables an initial analysis of the effectiveness of Trump 2.0 tariff policy precisely with respect to the two economic goals just outlined.
Increase in federal revenues
President Trump has repeatedly stressed that tax revenues from tariffs are necessary for the budget deficit, and indeed, in the January–July period, tariff revenue is estimated to have reached $122 billion, more than double the same period in 2024.
If in the first two months of 2025 monthly tax revenues from tariffs were on the order of $7 billion—broadly in line with last year’s monthly average—starting in March, with the first executive orders, they rose rapidly, reaching nearly $30 billion in July. It is particularly noteworthy that over two-thirds of the most recent revenues are attributable to tariffs imposed on goods from China and Asia.
Fig.1 - U.S. tax revenues due to import duties
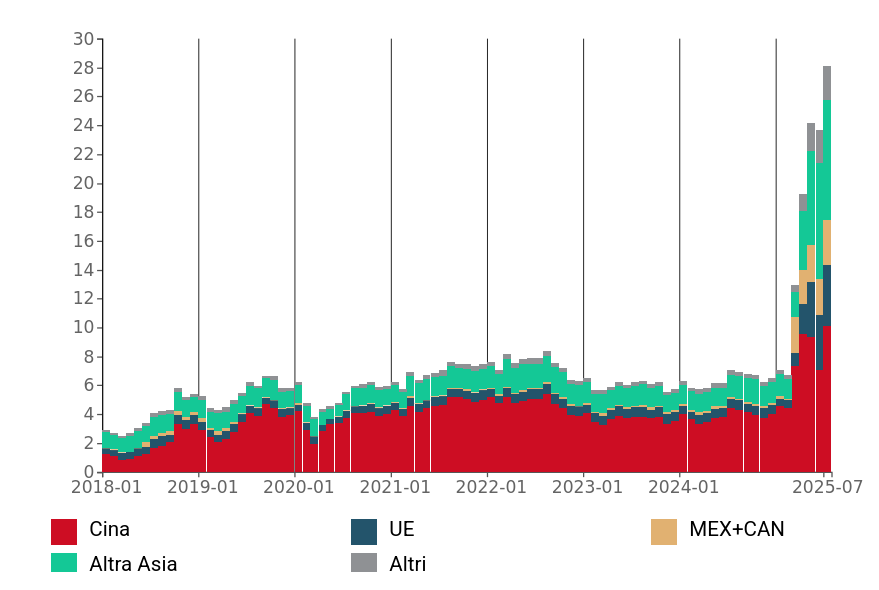
Source: ExportPlanning calculations based on United States International Trade Commission data
Tariffs are therefore certainly helping to increase U.S. tax revenues; however, when compared with the size of the federal deficit, their weight remains limited and below 10%. Specifically, the U.S. deficit is expected to decline from $1,915 billion in 2024 to about $1,800 billion in 2025 thanks to higher tariff revenues. This is a marginal improvement and insufficient to offset the deficit growth projected for the following years, given the average reduction in direct tax rates introduced by the tax reform contained in the Big Beautiful Bill.
A second point that is essential to clarify is that the party required to pay the duty at customs is the American importer, i.e., the economic operator on whom the tax falls. Foreign firms exporting to the U.S. market do bear a potential indirect negative effect (through possible demand declines or margin compression), but they are not the parties that physically pay the tax, contrary to what is implied by the U.S. administration’s narrative.
Recovery of U.S. manufacturing
In the United States, overall manufacturing output has never fully recovered to pre–Great Recession levels, as the following chart clearly illustrates. Although this is a phenomenon shared by several advanced economies, it is no surprise that the promise of a revival in American manufacturing has found particular favor among U.S. voters.
Fig.2 - Overall manufacturing output
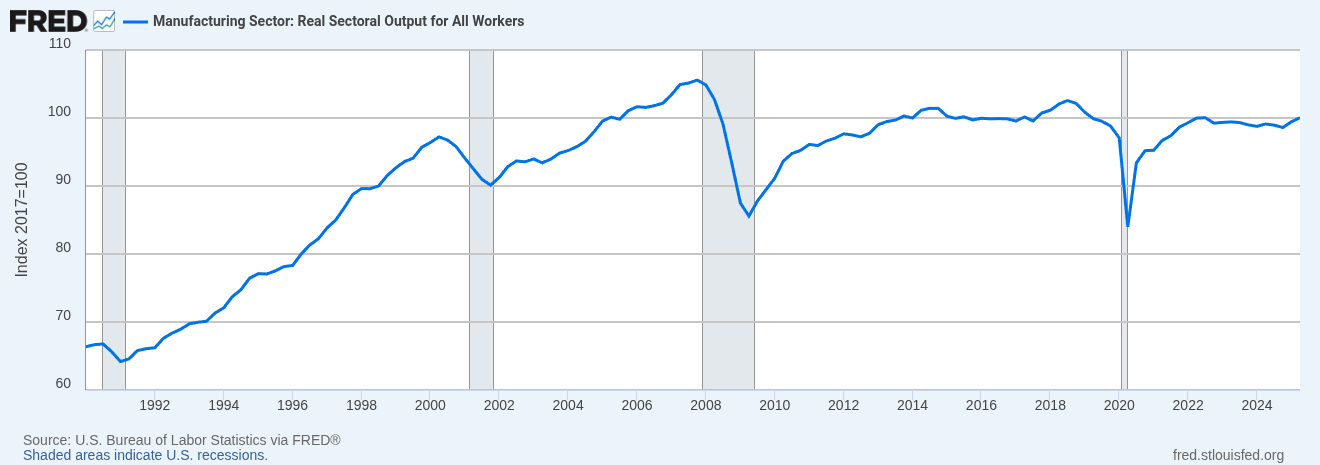
Source: FRED
An indirect indication of the effects of U.S. protectionist policy on the potential onset of a recovery phase in American manufacturing can be drawn from the joint analysis of the dynamics of goods imports and the trend in average import prices.
In particular, evidence of reduced imported volumes accompanied by a decline in average unit prices could be interpreted as a sign of the difficulties foreign producers face in maintaining their shares in the U.S. market. Such a situation would indicate that foreign suppliers, in an effort to preserve their competitiveness, are forced to accept a contraction in profit margins, thereby partially offsetting the effect of tariffs on final prices.
Conversely, a simultaneous increase in imported quantities and average prices would suggest that the competitive deficit of U.S. firms is not primarily due to price factors but rather to structural elements over which higher tariffs would exert only a marginal influence.
The importance of purging U.S. import data of anomalous flows
Before proceeding to analyze the dynamics of U.S. imports in recent years, it is necessary to cleanse the data of a significant anomaly observed in the first quarter of 2025, a period in which U.S. imports increased by 12% at constant prices compared with the fourth quarter of 2024 and by 25% compared with the first quarter of 2024.
A breakdown by product sector and partner country shows that this increase is attributable to a set of phenomena, including the presence of exceptional flows that temporarily alter the overall performance of imports. As anticipated in the article U.S. imports in Q1 2025: Gold, Pharmaceuticals, and Technology drive trade, the main anomalies concern:
- extraordinary imports of precious metal processing (mainly gold for investment and industrial purposes) from Australia and, above all, Switzerland;
- a sharp increase in imports of pharmaceuticals from Switzerland, Germany, and Ireland;
- exceptional flows of basic pharmaceutical products from Ireland.
The historical trend of these flows, shown in the next chart, clearly highlights the episodic and extraordinary nature of the anomaly recorded in the first quarter of 2025.
The observed spike lies well outside the levels that have characterized these flows over the past fifteen years, confirming the presence of an isolated event not attributable to ordinary market dynamics.
Consequently, this anomaly must be neutralized in the analysis to avoid distortions in the assessment of the structural trends of U.S. imports.
Fig.3 - U.S. imports of the aggregate of anomalous flows
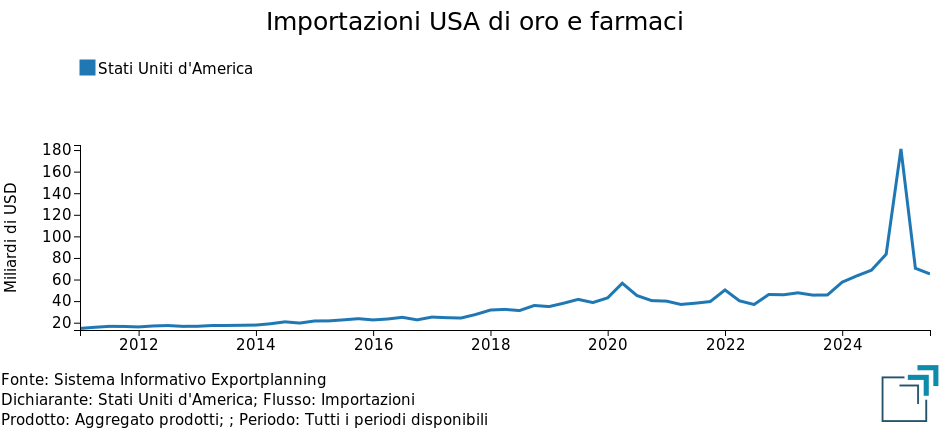
Source: ExportPlanning calculations
Cleansing total U.S. imports of anomalous flows, the change in imports at constant prices in Q1 2025 falls to 0.3% compared with the previous quarter and to 10.2% compared with Q1 2024.
Dynamics of U.S. goods imports and related average unit values
The two charts below show quarter-on-quarter changes in U.S. imports at constant prices and in terms of average prices, both adjusted for the effect of extraordinary flows.
Fig.4 - U.S. imports net of anomalous flows
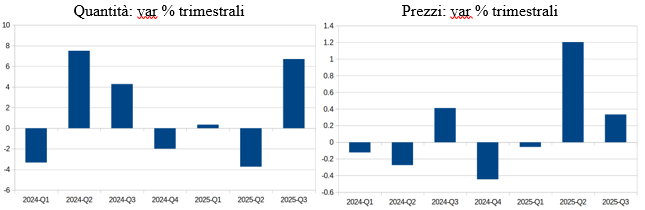
Source: ExportPlanning calculations
After a slight decline in imported quantities in the second quarter, the third quarter shows a recovery in imported volumes. On the price side, the signal—confirmed for two consecutive quarters—is one of increasing prices.
This evidence seems to suggest that the competitive deficit of U.S. firms stems more from structural factors than from price differentials, and that tariff measures are showing a limited impact in reviving domestic manufacturing.
On the other hand, it is very difficult for protectionist measures to change the production capacity of American manufacturing firms in the short term. It is reasonable to assume that U.S. companies, where possible, will primarily aim to maximize the utilization of existing plants, while the effects of new potential foreign direct investment will take years to materialize.
Conclusions
In conclusion, regarding federal revenues, the increase in revenue from tariffs represents a tangible result. However, their contribution to rebalancing public finances remains marginal when compared to the overall size of the federal deficit. Moreover, in this configuration, tariffs essentially function as tax levies that fall directly on American importers, scaling back the political narrative of an economic burden “shifted” onto foreign partners; they only partially compensate for the planned tax cuts, highlighting the redistributive effect of tariffs on the U.S. economy.
With regard to the recovery of U.S. manufacturing, the joint analysis of import volumes and average prices suggests that the competitive weakness of American industry has its roots in structural factors that are difficult to correct through customs measures alone.
Ultimately, in light of the current evidence, the trade policy of the new Trump administration appears to be of limited effectiveness with respect to the two stated economic objectives. It should be emphasized that this assessment does not imply an overall judgment of effectiveness with respect to other non-economic goals—such as geopolitical or strategic ones—which lie outside the scope of our analysis.
The results available so far should, in any case, be considered preliminary and will require further analytical investigation, for example by segmenting the overall trend with respect to different trading partners, first and foremost the European Union and China.
You may be interested in:

US Tariffs: Even More Uncertainty?
Published by Marzia Moccia. .
United States of America Uncertainty Trade war Global economic trends“Tariff is the most beautiful word in the dictionary”, stated Donald Trump during his second campaign for the White House, clearly foreshadowing the central role that tariffs would play in shaping t}... [ Read all ]

Measuring the effects of U.S. tariffs: a comparison among major trading partners
Published by Simone Zambelli. .
Europe United States of America Export Economic policy Foreign market analysisMeasuring the effects of U.S. tariffs: a comparison among major trading partners [ Read all ]

Are Trump’s tariffs really reshaping EU exports?
Published by Simone Zambelli. .
Europe United States of America Export Economic policy Foreign market analysisA sector-by-sector look at the state of US-EU trade [ Read all ]