Protectionism and Weaknesses in Global Economy: Evidence from International Trade
CPB and ExportPlanning indexes report a decrease in global demand
Published by Marzia Moccia. .
Slowdown Macroeconomic analysis Conjuncture Uncertainty Trade war IMF Global economic trendsGlobal economic weakness marks out the current international situation. One of the key indicators of economic performance is the Purchasing Managers’ Index (PMI) which summarizes the prospects regarding the levels of industrial activities based on business purchases. As shown in the chart below, Manufacturing PMI experienced a gradual decrease during 2018, falling below the threshold of 50 in recent months. This is the sign of a significant slowdown, since it indicates that most of the purchasing managers interviewed expressed bearish prospects for global manufacturing activities.
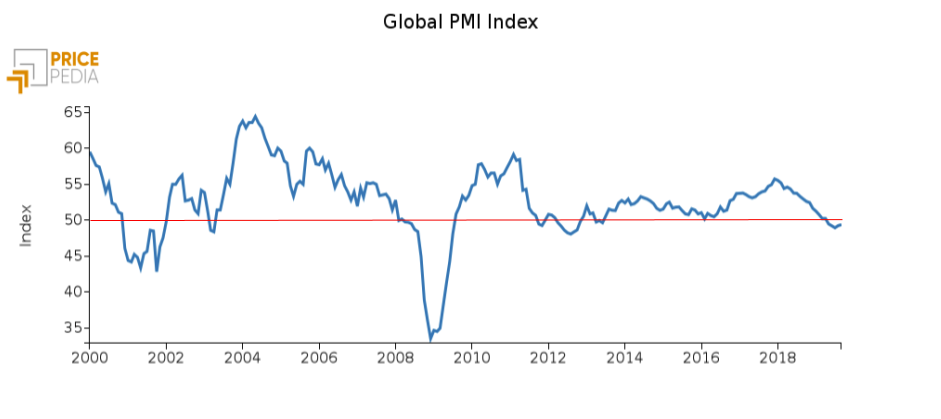
Source: Pricepedia
Establishing how much of the current slowdown is attributable to the US-China trade war or, more generally, to President Trump's protectionist measures, is trivial, but expectations of international economic operators have been abruptly worsened by the trade war uncertainty.
The list of threats and protectionist actions carried out by the Trump administration is particularly long and begins precisely in the early months of 2018 when, after the imposition of tariffs on solar panels and washing machines, the American administration hit steel and aluminum. The threats against Mexico and Canada for the renewal of the NAFTA, together with the actions against China, have represented two further developments of the American protectionist path, up to the open battle against the EU.
Under this set of events, business expectations about future output has experienced a significant reduction, but what were the effects on international trade?
The effects on international trade
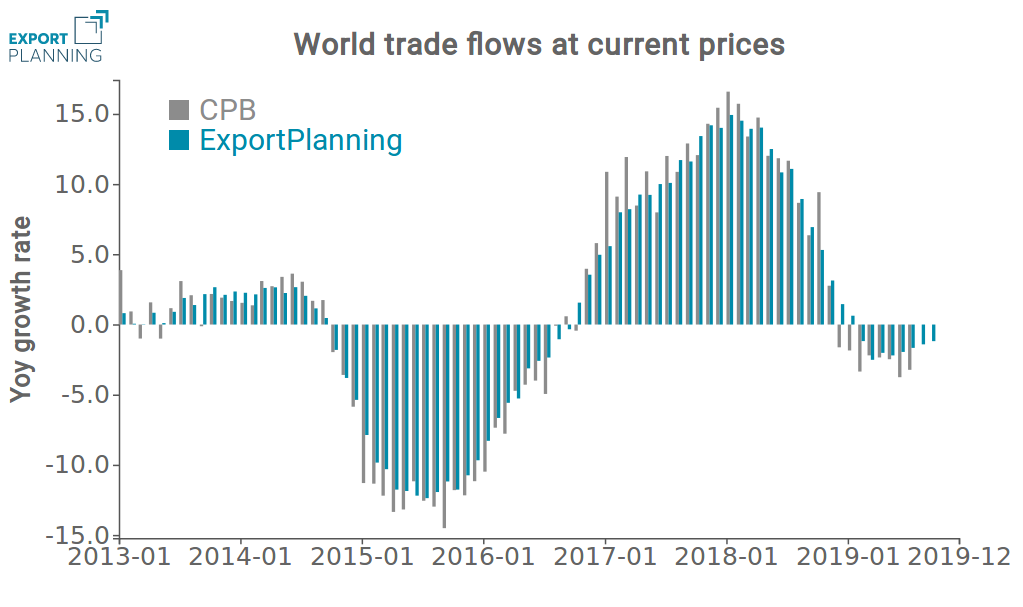
Source: ExportPlanning
From the second half of 2018, the growth of international trade flows - measured in current US Dollars - experienced a downward trend.
As reported by the CPB index and the ExportPlanning index, the Y-o-Y growth rate of international trade started to slow down since mid-2018, to turn negative in early 2019 due to the intensification of the US-China trade war.
However, these indexes reflect not only world trade changes in terms of volume, but also the effects of exchange rate and price adjustments, particularly clear during the 2015-2016 period, when the US Dollar experienced a phase of appreciation.
To extract from this indicator the component that only measures the growth of international trade in terms of volume, it is necessary to deflate international trade index with a price index in US Dollars. Various methods exist to carry out this deflation.
The CPB Netherlands Bureau for Economic Policy Analysis deflates the trade flows through a price index obtained by considering the exchange rates of the various currencies and the inflation rate in the various countries, derived from consumer, wholesale and production price surveys. ExportPlanning deflates the trade flows at single Harmonized System code (over 5000 product codes) level using the relative average unit value and then re-aggregating.
The following graph shows the dynamics of world demand at constant prices calculated by CPB and ExportPlanning (the 2019 figure is calculated based on the first 7 months of the year). The two measurements, despite being result of different methodologies, are very similar to each other and lead to consider them as reliable measurement methods to analyze world trade performance.
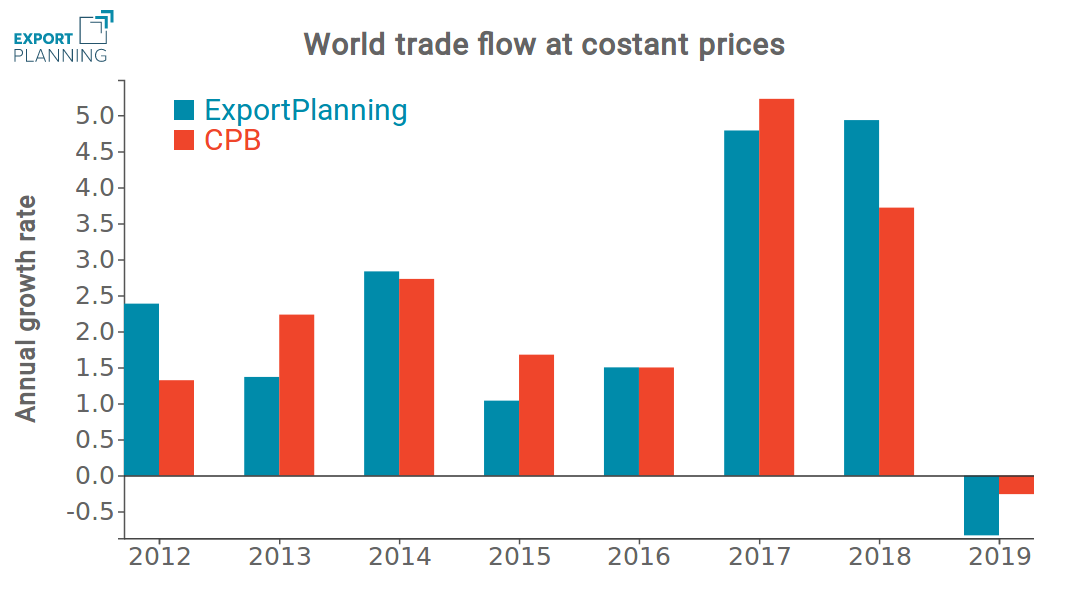
Source: ExportPlanning
World trade has entered a phase of substantially zero growth, if not contraction in terms of volume. The trend is particularly negative, especially compared to the growth experienced during 2017 and 2018. Although the contraction is not wide, in this century world trade growth entered negative territory only during the Great Recession in 2009 and the bursting of the dot-com bubble in 2001.
Conclusions
The weakness of the current economic situation seems to be deeply linked to the stagnant dynamics of international trade, caused by the protectionist turn of the American administration.
In an increasingly globalized world and internationally integrated value chains, a reduction in international trade has materialized into a significant threat to global production levels. In fact, trade seems to be one of the main drivers of the growth of the world economy, whose loss shifts the weight of growth to the services sector, which seems to show a greater degree of resilience compared to the weakness of the manufacturing industry. The presence of fiscal policies aimed at keeping the world economy on a growth path is becoming more and more relevant, in order to amplify the effects of monetary policies, which would otherwise have a limited effect in most cases.
Based on the forecast scenario of the International Monetary Fund, global growth - measured by aggregating the values of the different countries measured in $ - in 2019 is estimated close to 2.5% . In the years ahead it should show a slight acceleration, remaining within the 2.5%-3.0% range. The hypothesis of this scenario, however, necessarily presupposes that the Trump administration begins to acknowledge that the trade war is not giving significant results in terms of rebalancing the US trade deficit.
You may be interested in:

Global trade in footwear machinery: China dominates, Italy leads the way in premium technology
Published by Mauro Badanelli. .
Industrial equipment Conjuncture Foreign markets International marketingThe footwear machinery industry represents one of the pillars of manufacturing innovation in the fashion sector. In an increasingly competitive environment, characterized by global markets, growing }... [ Read all ]
World Trade Trends: International Trade Results in Q2 2026 (Preliminary Estimates)
Published by Marcello Antonioni. .
Home items Fashion Food&Beverage Metal industry Intermediate goods Electronics Chemicals Industrial equipment Conjuncture Automotive Global demand Industries Global economic trendsStrengthening dynamics, driven by AI applications, and the green and digital transitions [ Read all ]

IMF WEO Update July 2026: a (precarious) balance between war and technology
Published by Alba Di Rosa. .
Macroeconomic analysis Asia Emerging markets United States of America Uncertainty IMF Eurozone Global economic trendsPer il 2026 il Fondo ha rivisto lievemente al ribasso le stime di crescita del PIL mondiale, ora previsto al +3% [ Read all ]