U.S. Imports in Q1 2025: Gold, Pharmaceuticals, and Technology Lead the Surge
Published by Simone Zambelli. .
United States of America Import Foreign market analysis
In recent weeks, the sharp surge in U.S. goods imports in the first quarter of 2025 has caught the attention of international media, indicating a year-over-year nominal increase of 25% — that is, compared to Q1 2024 — and a quarter-over-quarter rise of 10% — that is, compared to Q4 2024.
Analyzing the most recent period, this increase has few precedents, except perhaps during the post-pandemic import recovery phase, as shown in the following chart. Many commentators have interpreted this trend as a frontloading of imports to avoid tariffs that the Trump administration indeed implemented on April 2 of this year.
Fig. 1 – U.S. Imports
(year-over-year change in dollars)
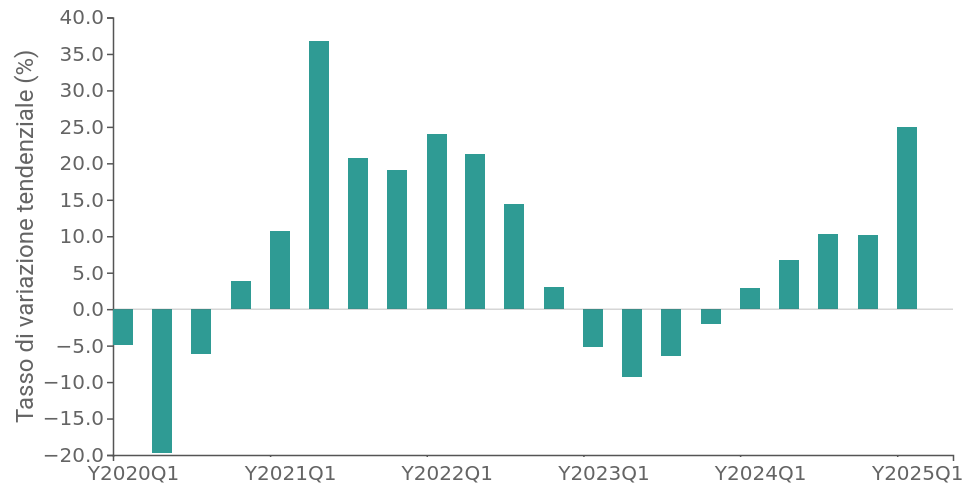
Source: ExportPlanning
However, interpreting this trend requires caution: in particular, it may be useful to “clean” the overall data from potential outliers and segment different import categories to isolate those that can be interpreted as actual “advance purchases” from those driven by different signals.
Breaking the analysis down by sector clearly shows that the overall result includes dynamics of varying nature.
The following table lists, in descending order, the main U.S. import sectors during the first months of 2025. For each sector, the following are indicated:
- the total year-over-year change in imports in Q1 2025 compared to the same period in 2024;
- the adjusted year-over-year change, which excludes products that recorded the largest deviations compared to the previous year, to reduce potential distortions caused by exceptional factors.
This dual reading makes it possible to distinguish between actual growth and growth influenced by extraordinary events, thereby providing a more accurate analysis of sector-specific import trends.
| Sector | Total Change 2025-Q1 | Adjusted Change 2025-Q1 |
|---|---|---|
| Jewelry, watches, and costume jewelry | 584% | 46% |
| Basic pharmaceutical products | 493% | 15% |
| Medicines | 70% | 55% |
| Computers and peripheral units | 54% | 34% |
| Computer parts and other office machines | 63% | 40% |
| Communications equipment | 39% | 30% |
| Precious metals | 140% | 57% |
The table confirms that in the first quarter of 2025, certain sectors — particularly jewelry, precious metals, and basic pharmaceuticals — recorded extraordinary increases in imports, although these were heavily influenced by a few specific products. Conversely, sectors such as medicines, IT, and communications show more balanced growth, suggesting more structural trends.
Let us now break down imports not only by sector but also by country of origin.
The boom in precious metals: between finance and production
One of the most significant elements emerging from trade data is the sharp increase in gold imports. This precious metal continues to serve as a safe haven in a global context marked by economic uncertainty, persistent inflation, and geopolitical tensions. Most of the imported gold arrived in the U.S. as refined bullion, primarily from Switzerland, one of the world’s main gold processing centers.
Silver followed a similar trend, although on a smaller scale, with Kazakhstan as the main supplier. In parallel, imports of unprocessed gold and silver were observed, used partly in the tech industry and partly as a store of value, coming from Canada, Mexico, and Colombia. According to an analysis published by S&P Global, this dynamic intensified due to a favorable price differential in the U.S. market, which encouraged the physical entry of refined gold into the country, especially through New York’s air cargo hub (see the following article).
Pharmaceuticals: the Irish hub
Another sector worthy of attention is pharmaceuticals, with rising U.S. imports of both basic and finished products. The U.S. purchased large volumes of hormones and biochemical compounds from Ireland, confirming its central role as a global pharmaceutical hub due to the presence of numerous multinational plants — a trend that may reflect intra-group movements in response to a threatened tariff action (which seems to have taken on a more cautious tone recently).
In addition to basic products, imports of immunological products and specialized medicines also increased, sourced not only from Ireland but also from Germany and Switzerland. This confirms the strong supply chain ties with the European Union, supported by major localizations of American multinationals.
Technology and semiconductors: Asian dependence remains high
The third major factor driving the unprecedented import growth in Q1 2025 is the technology sector. The U.S. imported large quantities of computers, peripherals, and advanced electronic devices, especially from Mexico and Taiwan. Imports also included combined units for data processing, which are in high demand in commercial, industrial, and military sectors.
Processors, integrated circuits, and memory chips — critical to the semiconductor industry — deserve special mention. The main suppliers in this area are Taiwan, Malaysia, Vietnam, and South Korea, whose role as U.S. suppliers increased following the onset of the U.S.-China trade war.
The high dependence on Asian suppliers continues to represent a strategic issue for U.S. economic security. Smartphones, classified under communications equipment, were also among the most imported products, mainly from China, India, and Vietnam.
Conclusions
What has been dubbed a “buying spree” in the U.S. market should be interpreted through an integrated reading of several phenomena. Geopolitical events, increased uncertainty, and gold stockpiling, as well as intra-group movements, suggest that the data as a whole must be read with caution.
The inventory effect will necessarily be followed in the coming quarters by a reduction in demand and imports. However, to fully understand the scope and consequences of this trend, it will be essential to closely monitor data in the upcoming quarters. Only then will it be possible to distinguish between cyclical dynamics and structural changes in international trade and assess how the U.S. economic and industrial system responds to the new wave of protectionism.
You may be interested in:

US Tariffs: Even More Uncertainty?
Published by Marzia Moccia. .
United States of America Uncertainty Trade war Global economic trends“Tariff is the most beautiful word in the dictionary”, stated Donald Trump during his second campaign for the White House, clearly foreshadowing the central role that tariffs would play in shaping t}... [ Read all ]

Measuring the effects of U.S. tariffs: a comparison among major trading partners
Published by Simone Zambelli. .
Europe United States of America Export Economic policy Foreign market analysisMeasuring the effects of U.S. tariffs: a comparison among major trading partners [ Read all ]
Are Trump’s tariffs really reshaping EU exports?
Published by Simone Zambelli. .
Europe United States of America Export Economic policy Foreign market analysisA sector-by-sector look at the state of US-EU trade [ Read all ]