Global Goods Trade in the first quarter: Rising Uncertainty
Published by Marzia Moccia. .
Slowdown Conjuncture Foreign markets Uncertainty Global economic trendsIn an international context marked by the re-emergence of geopolitical and trade tensions — compounded by the recent conflict in the Middle East — the outlook for 2026 in terms of economic growth and inflation dynamics is characterized by a high degree of uncertainty. In such a scenario, the continuous monitoring of high-frequency, up-to-date economic data represents an essential tool for reducing uncertainty, enabling a timely and updated reading of the evolution of the global economic cycle.
In particular, the availability of the update for Q1 2026 of ExportPlanning foreign trade data highlights how the figures for the first months of 2026 confirm a picture of substantial continuity with 2025, a year that showed significant resilience in global trade in goods (for further details see the article “Q1 2026: global trade between resilience and fragmentation”). The most recent short-term evidence indicates an alignment of the growth profile with the levels observed during the previous year: ExportPlanning nowcasting models estimate a year-on-year growth in global demand of 6.5% at constant prices for the first quarter of 2026.
Against this aggregate dynamic, however, a relative heterogeneity in growth trajectories emerges. The overall performance of international trade reflects differentiated contributions across production sectors, with non-uniform expansion intensity and cyclical positioning. A sectoral breakdown analysis allows us to describe and identify the underlying drivers of the overall resilience of international demand, highlighting divergences and specific features.
The map of trade by industry
The chart below represents the main industries involved in international trade in goods, positioned based on the growth rates at constant prices of imports recorded in the second half of 2025 (X-axis) and those relating to the latest available quarter (Y-axis). This representation provides a concise and immediate reading of foreign demand dynamics, allowing the identification of the most recent evolutionary patterns and any changes in the pace of expansion.
The bisector (shown in yellow) serves as a key interpretative reference: industries positioned along the bisector show a growth rate broadly in line with the second half of 2025, while those below the line indicate a slowdown and those above signal, conversely, an acceleration.
The size of each bubble is proportional to the total trade volume of that industry in 2025.
Fig.1 – Map of global demand by industry at constant prices
(year-on-year changes at constant prices, Jun-Dec 2025 vs Jan-Mar 2026)
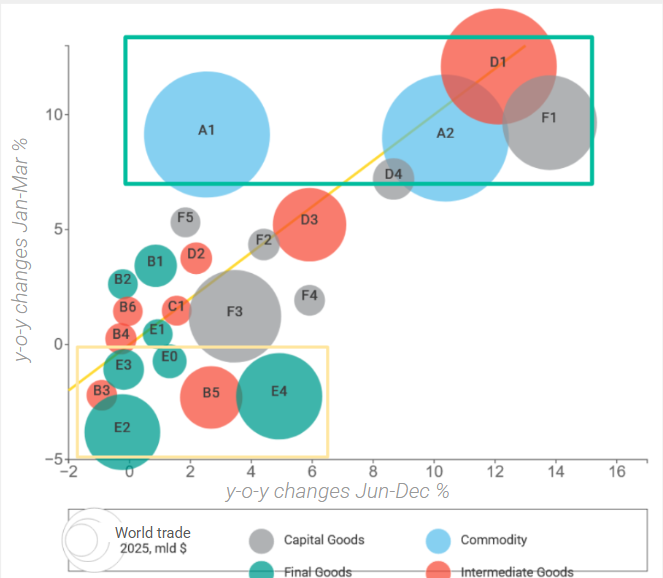
Source: ExportPlanning
A particularly interesting aspect is that it is possible to clearly identify several clusters of industries based on their growth pace.
Industries driving growth
The green upper quadrant identifies the industries supporting global demand; in particular, the following can be highlighted:
- ICT equipment (F1) and related electronic components supply chain (D1): growth is closely linked to the increase in global demand for CPUs, processing units, and processors, reflecting still-robust global demand for high-tech goods despite the growing diffusion of Artificial Intelligence technologies and the consequent expansion of global digital infrastructure. In this case, it represents the continuation of an already positive growth pace observed last year;
- Electrical engineering (D4): demand for electrification-related technologies remains very strong — again, in relative continuity with the second half of last year;
- Commodities (A1 and A2): the first quarter generally signals a strong strengthening in global demand for both Natural Raw Materials (A1) — rebounding from last year — and Industrial Raw Materials (A2). This phenomenon may indicate a progressive accumulation of inventories by firms amid a significantly more uncertain international environment.
Industries slowing down
On the opposite side are industries experiencing the greatest slowdown compared to the second half of 2025. It is noteworthy that the yellow quadrant mainly consists of Consumer Goods, particularly:
- Healthcare system (E4) and chemical intermediates (B5): gradually normalizing after a particularly strong expansion pace last year;
- Fashion system (E2), Home system (E3), and Food and Beverage (E0): characterized by weakening demand;
Also noteworthy is the slowdown in the Machinery sector (F4), which had benefited from a significant boost in 2025, partly driven by semiconductor-related technologies. In the most recent phase, the deceleration appears widespread, reflecting a broad-based weakening in demand for capital goods machinery.
Conclusions
Overall, a sectoral reading of global demand allows for a more nuanced qualification of the resilience observed at the aggregate level. While the overall dynamics of international trade continue to maintain sustained growth rates, the disaggregated analysis highlights the first signs of adjustment driven by uncertainty in the international context.
The strengthening of commodity demand observed in the first quarter may reflect a phase of precautionary stockpiling and, at the same time, the widespread weakening in consumer goods is consistent with a more cautious stance by final demand.
At the same time, global demand growth appears increasingly polarized in favor of higher-tech sectors. Supply chains linked to ICT, electronics, and electrification processes continue to show robust expansion dynamics, supported by structural drivers such as digitalization and the spread of artificial intelligence.
Taken together, this evidence suggests that the current economic phase, while maintaining an overall resilient profile, is progressively incorporating the effects of global uncertainty, through increasing divergence across sectors and a qualitative reshaping of international demand.
You may be interested in:

Blue jeans, shifting geographies: the challenge faced by new manufacturing Countries to China and Bangladesh
Published by Mauro Badanelli. .
Fashion Export Foreign markets International marketingBlue jeans: an iconic fashion product Blue jeans are one of the iconic products of the apparel industry, with a well-established presence in markets around the world and demand spanning generat}... [ Read all ]

Dyeing machinery: innovation and sustainability at the heart of a changing supply chain
Published by Mauro Badanelli. .
Industrial equipment Export Foreign markets International marketingDenim is one of the cornerstones of the global apparel industry. Every year, billions of garments are produced and sold worldwide, fueling demand from fast fashion brands, premium manufacturers, and}... [ Read all ]

IMF WEO Update July 2026: a (precarious) balance between war and technology
Published by Alba Di Rosa. .
Macroeconomic analysis Asia Emerging markets United States of America Uncertainty IMF Eurozone Global economic trendsPer il 2026 il Fondo ha rivisto lievemente al ribasso le stime di crescita del PIL mondiale, ora previsto al +3% [ Read all ]