Plastics processing machinery: what are the main markets and how is the competitive landscape evolving?
Published by Mauro Badanelli. .
Industrial equipment Conjuncture Industries International marketingPlastic processing machinery represents one of the most important technological pillars of modern manufacturing supply chains. Through processes such as injection moulding, extrusion, blow moulding and thermoforming, these machines enable the production of a wide range of products serving strategic sectors of the global economy. From automotive components to food packaging, from medical devices to construction materials, as well as electronics and consumer goods, the quality, efficiency and technological sophistication of the machinery employed directly influence the performance of the final products. Moreover, the growing demand for lighter, more sustainable and higher-performance materials is accelerating the technological evolution of the industry, driving investments in automation, process digitalisation and the use of recycled and bio-based materials.
In this context, international trade in plastic processing machinery1 represents a significant indicator of the ability of industrial systems to innovate and respond to the evolving dynamics of global demand.
Global trade in plastic processing machinery
According to data available in the ExportPlanning Information System, international trade in plastic processing machinery reached 19.6 bln € in 2025, down by 1.4% at current prices compared with 2024.
Nevertheless, over the 2009–2025 period, international trade recorded an average annual growth rate of +3.5%, mainly driven by the strong expansion experienced during 2021–2022.
Fig. 1 – Global trade in plastic processing machinery
(current prices)
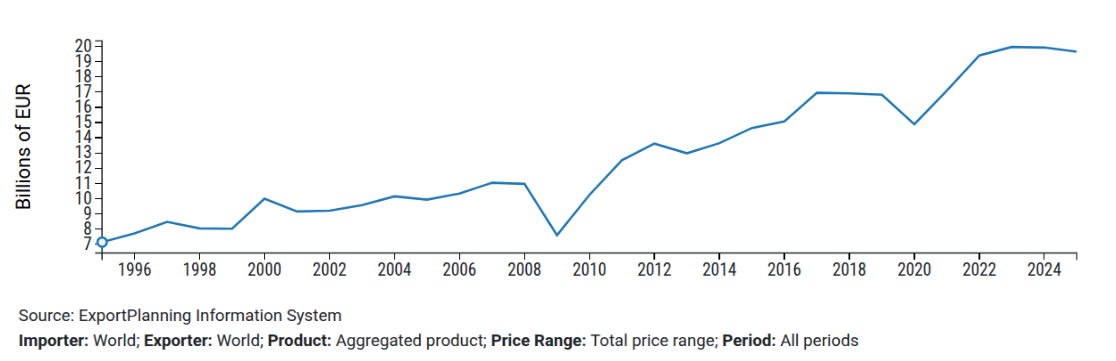
Source: ExportPlanning
Market conditions in the first quarter of 2026 did not show any significant change compared with the negative trend observed throughout 2025. Global trade declined by more than six percentage points compared with the same period of 2025. The overall performance was mainly affected by the contraction in Asian exports during the first months of the year. By contrast, the European Union recorded positive year-on-year growth, while Italy experienced a decline of more than ten percentage points.
Table 1 – Plastic processing machinery: comparative performance
Year-on-year percentage changes at current prices
| 2023 | 2024 | 2025 | Q1 2026 | |
| Global demand | +2.9% | -0.2% | -1.4% | -6.4% |
|---|---|---|---|---|
| EU exports | +8.5% | -5.4% | -6.3% | +1.6% |
| Italian exports | +14.2% | +2.4% | -5.5% | -11.6% |
| Asian exports | -0.2% | +7.9% | +1.8% | -10.1% |
| Chinese exports | +1.2% | +21.1% | +6.4% | -6.8% |
Source: ExportPlanning Information System
Would you like to receive a selection of the most relevant international trade news every week? Subscribe to the World Business Newsletter free of charge!
Main markets
The world's leading destination markets for plastic processing machinery are China, the United States and India. In 2025, China imported machinery worth 2 059 mln €, accounting for a 10.5% share of global imports. Between 2009 and 2025, Chinese imports recorded a compound annual growth rate (CAGR) of +1.2% at current prices. Compared with the other major markets, China experienced a significant reduction in imports, increasingly replacing foreign machinery with domestically manufactured equipment. As shown in Figure 2, however, the Chinese market continues to absorb primarily high-quality machinery.
The United States imported plastic processing machinery worth 1 815 mln € in 2025, representing 9.2% of international trade. Over the 2009–2025 period, imports recorded a CAGR of +5.9%. India, meanwhile, posted an average annual growth rate of +8.5%, with imports reaching 1 484 mln € in 2025.
Together with Brazil, Vietnam, Indonesia and Mexico, India is among the markets that have significantly increased their imports of plastic processing machinery over the past five years. However, as illustrated by the premium price analysis in Figure 2, this growth has mainly involved lower-priced machinery. The United States, by contrast, stands out as a high-value market characterized by strong demand growth for medium-high and premium-quality machinery.
Fig. 2 – Plastic processing machinery: premium price analysis in the most dynamic markets
(2020–2025)
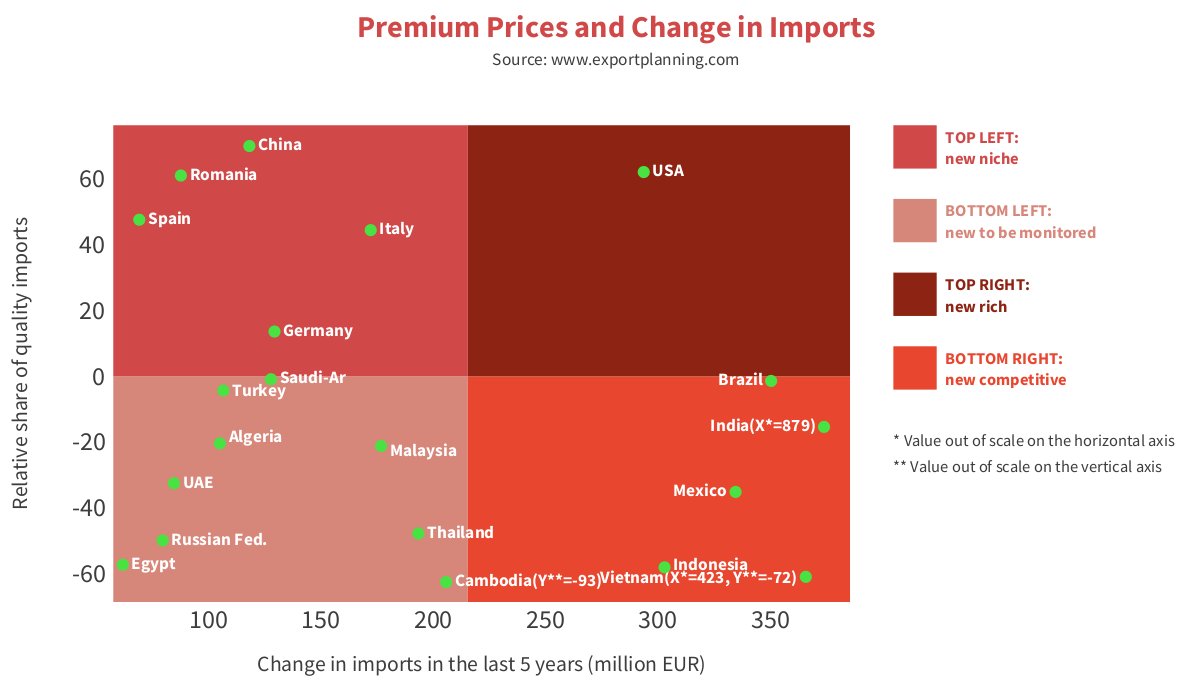
Source: ExportPlanning analysis – Reporting Tool
Competitive landscape
China dominates the global competitive landscape for plastic processing machinery exports. In 2025, it was the world's leading exporter, accounting for a 30.4% market share with exports valued at 6 229 mln €. It was followed by the European economies of Germany, Italy and Austria, while Japan ranked next. Only Germany recorded a market share exceeding 20% in 2025, whereas all the other major exporting countries accounted for less than 10% of global exports.
Between 2009 and 2025, China experienced remarkable export growth, posting a compound annual growth rate (CAGR) of +11%. The main foreign markets for Chinese manufacturers include Vietnam, India, Indonesia, Thailand and Russia. Chinese exports continue to be characterized by a strong concentration in the low- and medium-low-price segments.
Germany exported plastic processing machinery worth 4 194 mln € in 2025, a value 2.8% lower than the previous year. Over the 2009–2025 period, German exports recorded a CAGR of +1.9% at current prices.
For Italy, exports amounted to 1 813 mln € in 2025, representing a 5.5% decline compared with the previous year. Nevertheless, over the 2009–2025 period, Italian exports achieved an average annual growth rate (CAGR) of +1.9%.
Conclusions
The analysis highlights how the international market for plastic processing machinery is evolving according to increasingly differentiated competitive dynamics. On the one hand, several markets continue to compete primarily on price; on the other, a growing number of countries are rewarding solutions with higher technological content, greater energy efficiency, advanced automation and enhanced sustainability.
In such an environment, the ability to promptly interpret changes in global demand, monitor the most dynamic markets and assess competitors' positioning becomes a strategic asset. These capabilities enable companies to identify the most promising growth opportunities and to develop more effective internationalisation strategies.
1. The Harmonized System (HS) codes considered for this analysis are: HS847710, HS847720, HS847730, HS847740, HS847759 and HS847780.
You may be interested in:

Plastics processing machinery: sectors where Italy leads the way
Published by Mauro Badanelli. .
Industrial equipment Foreign markets International marketingAs documented in this article, Italy ranks among the world's leading exporters in the plastics processing machinery industry, holding the 3rd position worldwide in 2025. The aim of this analy}... [ Read all ]

US Trade Deficit Put to the Test by Tariffs: Evidence from First-Half 2026 Data
Published by Marzia Moccia. .
Slowdown Conjuncture United States of America Uncertainty Trade war Foreign market analysisAmid uncertainty that has now become the new normal, international geopolitical tensions, and the reshaping of the rules governing global trade, the United States undoubtedly remains a key focus of }... [ Read all ]

In the plastics processing machinery sector, Italy maintains its role as technological leader
Published by Mauro Badanelli. .
Industrial equipment Competitor analysis Foreign markets International marketingAs highlighted in a previous article dedicated to the plastics processing machinery industry, Italy plays a leading role among the world's major technology suppliers. In fact, Italy ranks third worl}... [ Read all ]