Global Demand: Q1-2020 shows a better than expected scenario
World trade data about the first three months of the year suggest an "optimistic" scenario, with an overall downturn slightly higher than 10% in 2020.
Published by Giulio Grisanti. .
Conjuncture Global demand Foreign markets Global economic trends
After an already difficult 2019, world trade in the first quarter of 2020 registered a strong fall.
Measuring the intensity of this fall is particularly important in this phase of great uncertainty, since it can help us understand the effects on world trade of the health crisis and the consequent lockdowns in many countries around the world.
At the beginning of April, the WTO published two forecast scenarios for world trade: an optimistic one and a pessimistic one. Depending on the scenario, world trade is expected to fall by 13% or 32% in 2020. Analysis of the economic data can help us understand which of the two scenarios is actually taking place and whether the WTO assessments were correct.
The graph below shows the growth rates of the world demand measured in dollars calculated by:
- CPB (Netherlands Bureau for Economic Policy Analysis), by aggregating data on total imports of goods published by the statistical offices of the various countries;
- StudiaBo, within the Ulisse Information System, that takes into account the custom declarations made by companies in the 70 main world countries at the 6-digit Harmonized System customs code level. The related database is available in the Analytics section of ExportPlanning.
The high correspondence of the two series confirmes the reliability of both sources.
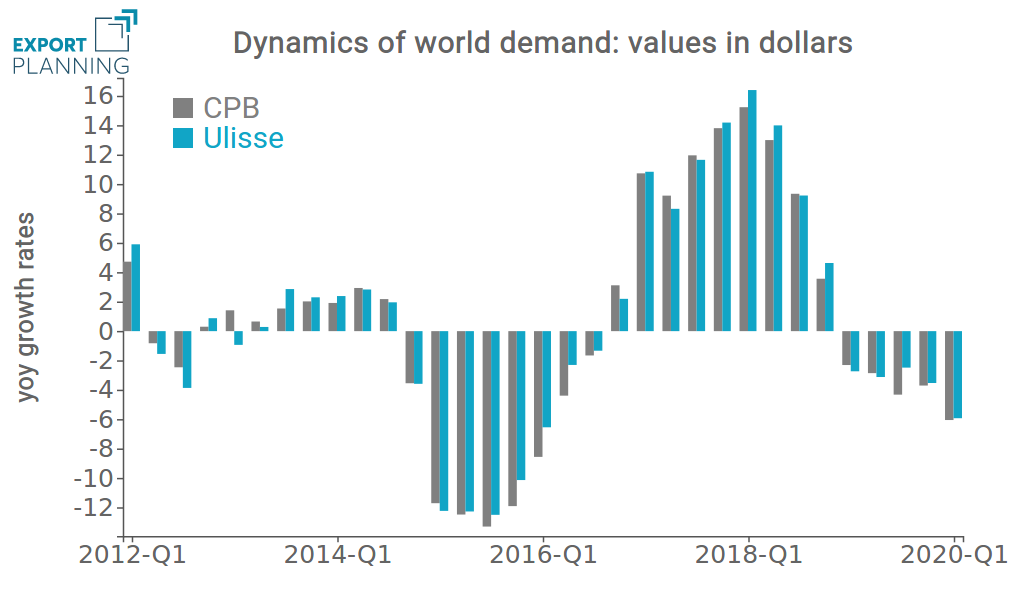
Source: ExportPlanning
Before reading the economic situation using the growth rates in world demand measured in current dollars, it should be considered that they reflect three phenomena:
- The dynamics of world trade in real terms
- The change in prices
- The change in exchange rates
Changes in both prices and exchange rates can have a higher impact than the dynamics of real trade, leading to distorted conclusions about the evolution of world trade compared to the real facts. A clear example of this is the dynamics of world trade measured in current dollars in the 2015-2016 period, which has fallen sharply. However, the intense fall in the two-year period is the result of a slowdown in trade, the collapse in commodity prices and, above all, the strong appreciation of the dollar. If, instead of analyzing world trade in dollars we analyzed it in euros, the dynamics of world trade would have been very different.
In this case it is necessary to purge the dynamics of world trade in dollars from the effects of price and exchange rate changes, while being aware that this elaboration involves the introduction of some simplifying assumptions, depending on the method used.
The graph below shows the dynamics of world trade at constant prices - calculated by purging changes in world trade in current dollars from both changes in prices and exchange rates - measured by both CPB and StudiaBo. The differences between the two series reflect the different deflation methods used. However, these differences are marginal and allow an unambiguous conclusion of what happened during 2019 and Q1-2020.
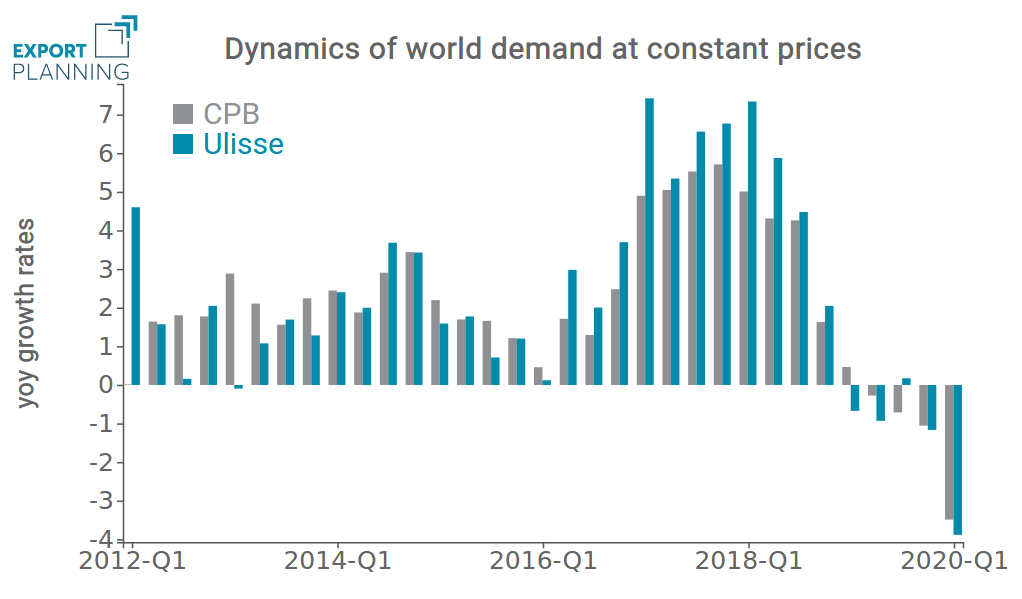
Source: ExportPlanning
The following facts emerge from the analysis of the dynamics of these two series:
- Because of the US-China trade war, in 2019 world trade started to show negative growth rates, around -1%.
- In the first quarter of 2020, the fall in world trade shows an acceleration, with a reduction between 3% and 4% compared to Q1-2019. Considering that in Q4-2008, in the aftermath of the bankruptcy of Lehman Brothers Bank, world trade fell by 6.5%, and that in the following quarters collapsed by about 20%, the fall in the first quarter of this year seems less dramatic. The fall in this first quarter includes the entire lockdown period of China and South Korea and the beginning of the European one. The downturn in trade in the second quarter of 2020 will be more intese, but the resilience of trade in Asia should avoid collapses similar to those of the first part of 2009.
Conclusions
The current phase of the world economy is characterised by profound uncertainty as to the intensity with which the simultaneous shock of supply and demand on multiple countries will result in falls in income, activity and international trade. However, with the available information on the first quarter of 2020, it can be affirmed - with caution - that the collapse in world trade in this crisis may be less intense than that which characterised the 2008-2009 period.
You may be interested in:

Global trade in footwear machinery: China dominates, Italy leads the way in premium technology
Published by Mauro Badanelli. .
Industrial equipment Conjuncture Foreign markets International marketingThe footwear machinery industry represents one of the pillars of manufacturing innovation in the fashion sector. In an increasingly competitive environment, characterized by global markets, growing }... [ Read all ]

World Trade Trends: International Trade Results in Q2 2026 (Preliminary Estimates)
Published by Marcello Antonioni. .
Home items Fashion Food&Beverage Metal industry Intermediate goods Electronics Chemicals Industrial equipment Conjuncture Automotive Global demand Industries Global economic trendsStrengthening dynamics, driven by AI applications, and the green and digital transitions [ Read all ]

Blue jeans, shifting geographies: the challenge faced by new manufacturing Countries to China and Bangladesh
Published by Mauro Badanelli. .
Fashion Export Foreign markets International marketingBlue jeans: an iconic fashion product Blue jeans are one of the iconic products of the apparel industry, with a well-established presence in markets around the world and demand spanning generat}... [ Read all ]