Monthly market data: a planning tool in a context of growing commercial uncertainty
The case of textile machinery in India shows how to turn monthly market data into Competitive Intelligence
Published by Mauro Badanelli. .
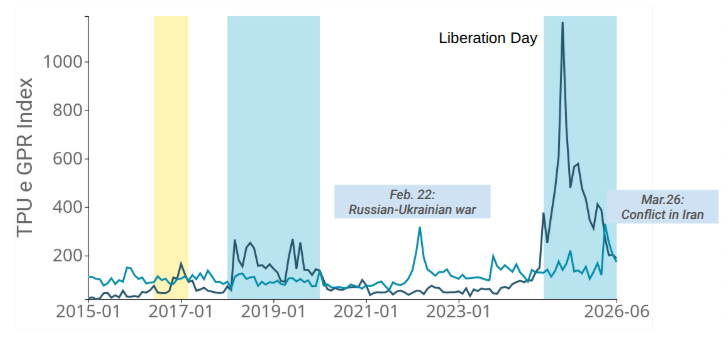
Planning Conjuncture Foreign markets Global economic trendsIn recent years, uncertainty surrounding global trade policy has reached unprecedented levels. The Trade Policy Uncertainty Index, which has historically remained within a relatively narrow range, reached record highs following the tariffs announced in April 2025 ("Liberation Day") and has remained elevated in recent months, also reflecting geopolitical instability across several regions of the world.
Geopolitical Risk Index and Global Trade Policy Uncertainty Index - up to June 2026
(indices based on monthly data)
Fonte: ExportPlanning
This is not an isolated perception. According to the 2025 Internationalisation Survey conducted among Lombardy-based companies by Confindustria Lombardia and Assolombarda, 61.6% of manufacturing companies located in one of Europe's most industrialised areas consider uncertainty to be the main factor affecting their strategies over the following twelve months. This is followed by rising raw material costs (52.6%), tariffs (49.8%), energy costs (45.6%), and transport and logistics costs (41.8%). The operational consequences are concrete: almost one in four companies surveyed reports having increased the frequency of budget reviews, while a similar share has already begun reconsidering target markets or sourcing strategies.
In this context, continuously monitoring markets and competitors becomes an integral part of planning. Monthly data make it possible to identify changes in demand, shifts in the market shares of leading suppliers, or unusual movements more quickly, providing useful signals for investigating their causes and assessing possible corrective actions.
This is the need addressed by the Monthly Market Data service developed by ExportPlanning.
The Monthly Market Data service
The Monthly Market Data service is designed for the Marketing, Controlling and General Management functions of medium-sized and large companies that are already active in exports and have a structured international business. Each month, it provides customs1 import data for a target country, broken down by supplier/trading partner and available both in value and quantity, with the possibility of also deriving price indices.
The main benefits include the ability to:
measure the company's market share in the monitored country and product;
track month by month the value and volume dynamics of the markets served, without having to wait for annual publications;
compare the company's performance with that of the overall market and the fastest-growing competitors;
support management control by assessing the sustainability of budget targets during the year.
The service can be used in two ways: as a "pure" data feed, for companies that integrate the figures into their internal analytical tools, or with the support of a specialised consultant who helps interpret the signals and translate them into operational priorities for the following month.
Are you interested in receiving a selection of the most relevant news of the week on international trade? Subscribe to the World Business Newsletter for free!
A use case: Indian imports of textile dyeing, washing and bleaching machinery
To illustrate how the service works, consider a use case based on Indian imports of machinery and appliances for washing, bleaching and dyeing yarns, fabrics or other textile products, identified by customs code HS845140.
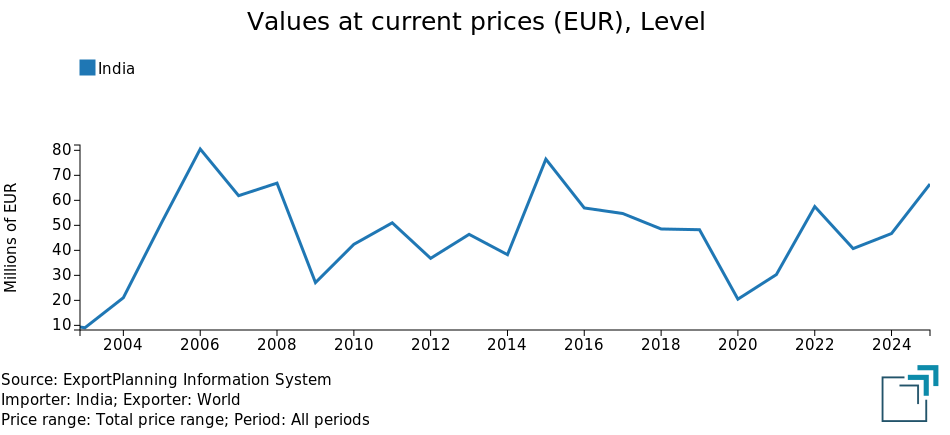
The Indian market has recorded strong growth in recent years, particularly over the last three years. Import value increased from approximately €40.6 million in 2023 to €66.5 million in 2025, corresponding to a CAGR of +27.8%. The first half of 2026 also confirms the market's growth, with a year-on-year increase of +26.2%.
Fig. 2 – India - Imports of dyeing, washing and bleaching machinery
However, behind this overall positive trend lie significant changes in the position of the different supplying countries.
Tab. 1 - INDIA - Imports of dyeing, washing and bleaching machinery (2025 and H1 2026)
| Supplier | 2025 € Mln |
Jan-Jun 2026 € Mln |
CAGR '23-'25 |
% Var. Jan-Jun '26 |
Share 2025 |
Share H1 2026 |
Trend Jan-Jun '26 |
|---|---|---|---|---|---|---|---|
| China | 16.9 | 8.8 | + 47.6% | - 0.9% | 25.5% | 24.2% | Decline |
| Italy | 13.2 | 3.8 | + 22.1% | - 36.6% | 19.9% | 10.4% | Decline |
| Germany | 12.7 | 17.9 | - 0.7% | + 399.4% | 19.2% | 49.4% | Growth above market |
| Türkiye | 6.3 | 2.1 | + 32.3% | - 37.8% | 9.4% | 5.9% | Decline |
| Taiwan | 4.5 | 1.1 | + 102.1% | - 56.6% | 6.7% | 3.1% | Decline |
| TOTAL IMPORTS | 66.5 | 36.3 | + 27.8% | + 26.2% | 100.0% | 100.0% |
Source: ExportPlanning calculations
In 2025, China was the leading supplier, with a 25.5% share, followed by Italy at 19.9% and Germany at 19.2%. In the first six months of 2026, the picture changed significantly: Germany became India's leading supplier, accounting for 49.4% of total imports, while China's share fell to 24.2% and Italy's to 10.4%.
In particular, compared with the same period in 2025, the value of imports from Italy decreased by -36.6%, while imports from Germany increased by +399.4%.
A reading based solely on aggregate data could therefore suggest a rapid structural change in the competitive position of the different suppliers. The monthly detail presented in Tab. 2, however, provides a better understanding of what lies behind these figures.
Tab. 2 - INDIA - Monthly import values - top 5 suppliers (€ thousand)
| Supplier | Jan 2026 | Feb 2026 | Mar 2026 | Apr 2026 | May 2026 | Jun 2026 |
|---|---|---|---|---|---|---|
| China | 1 125 | 8 289 | 2 085 | 2 785 | 1 012 | 943 |
| Italy | 784 | 905 | 614 | 35 | 34 | 1 424 |
| Germany | 2 292 | 2 114 | 1 886 | 1 333 | 8 704 | 1 607 |
| Türkiye | 68 | 330 | 199 | 205 | 702 | 642 |
| Taiwan | 204 | 225 | 478 | 60 | 175 |
Source: ExportPlanning calculations
For capital goods, monthly data are primarily about orders
Industrial machinery has a different characteristic compared with consumer goods or production inputs purchased on a continuous basis: imports are often linked to individual investments, new production lines or plant upgrades. As a result, customs data can be highly uneven from one month to another.
This is evident in the Indian case. The increase in German supplies, for example, is not evenly distributed over time. In May 2026, imports from Germany reached approximately €8.7 million, accounting for almost half of the value recorded in the first half of the year. A similar phenomenon had occurred in August 2025.
Italian supplies also show considerable variability: months with values above €2 million alternate with periods in which imports are very limited or absent.
Monthly data should therefore not automatically be interpreted as an indicator of a new structural trend. To measure changes in the market shares of capital goods, it is preferable to combine them with indicators covering longer periods, such as quarters or rolling twelve-month windows.
Yet it is precisely this discontinuity that makes monthly data particularly valuable for machinery manufacturers: their value lies not only in measuring market share, but also in their ability to provide an early signal of what is happening in the market.
So what information can monthly data provide to a machinery manufacturer?
Identifying major competitor deliveries
Comparing monthly data with indicators calculated over longer time horizons makes it possible to distinguish more precisely between episodic events and potentially structural dynamics. A sudden increase in imports from a given country may signal the delivery of a plant or a major order.
The German spike in May 2026, for example, provides very different information from a gradual increase spread over several months. The data alone do not make it possible to identify the customer or the nature of the supply, but they provide a signal that the sales management team can investigate further using its knowledge of the market, customers and local competitors.
In this sense, monthly customs data become a Competitive Intelligence tool: they do not necessarily explain the event, but they make it possible to quickly identify where further investigation may be worthwhile.
Distinguishing episodic events from competitive changes
Continuous monitoring also makes it possible to distinguish a single spike from a more persistent change.
If a competitor's growth is concentrated in one or two months, it is plausible that it reflects one or a few major orders. If, on the other hand, the increase continues for several consecutive months, the signal may be consistent with a more structural strengthening of its presence in the market.
This distinction is particularly important to avoid reacting to a single event as if it represented a permanent change in the competitive environment.
Comparing company performance with the market
Monthly data also make it possible to compare a company's orders or shipments with the overall import trend in the target market. A decline in company sales, in fact, has very different implications depending on whether it occurs in a market that is also slowing down or while overall imports are increasing.
In the latter case, it becomes appropriate to investigate whether the loss is concentrated in favour of specific competitors or supplying countries and to promptly assess the possible causes.
Improving in-year sales monitoring
For a sector characterised by a small number of high-value orders, waiting for annual data often means identifying a competitive change too late.
Monthly monitoring, by contrast, makes it possible to incorporate this information into periodic budget reviews and sales meetings, providing a basis for deciding which markets, competitors or customers require further investigation.
From data to decisions
Monthly customs data do not replace a company's commercial knowledge. On the contrary, they become valuable precisely when they are combined with the information held by those who operate directly in the market.
A spike in a competitor's imports may prompt an investigation into the existence of a new order; a progressive loss of market share may suggest a closer look at competitors' offers; market growth that is not accompanied by an increase in company sales may indicate a need to review commercial priorities or targets.
In the format that includes consulting support, this information can be periodically summarised by highlighting the main market changes, the company's position relative to competitors and the events that warrant further investigation.
Conclusions
The case of Indian imports of textile machinery shows that, particularly in the capital goods sector, the value of monthly data goes beyond simply calculating market share.
Their usefulness lies in the ability to identify competitive signals at an early stage: a major competitor delivery, a progressive loss of market position, the entry of new suppliers, or a divergence between company sales and the overall market trend.
Monthly data therefore become not only a measurement tool, but also an information base for guiding Business and Competitive Intelligence activities and supporting commercial decisions throughout the year.

1 Behind an import or export figure there is no estimate based on a sample, but rather the aggregation of millions of transactions actually carried out between companies and countries.
When observed at the right level of granularity, across consistent historical series and with appropriate analytical tools, these data become robust proxies for market size and dynamics. They make it possible to see whether a market is growing or slowing, which countries are gaining ground, where supply comes from, how competitors' shares are changing and where new trade flows are emerging.
They also offer another decisive advantage: timeliness. When much market information arrives with a delay or is available only through ad hoc research, customs flows make it possible to update the market picture frequently.
Combining these data with a broad, objective and continuously updated quantitative database within business processes, at a low investment cost, makes it possible to maintain a clear view of the markets of interest.
You may be interested in:

THE EU EXPORTS OF CAPITAL GOODS IN Q3-2026
Published by Marcello Antonioni. .
Metal industry Conjuncture Export Global economic trendsThe growth in European sales of capital goods (+6.9% year-on-year in euro) was driven by Tools and Equipment for ICT and Services and Electrical Engineering [ Read all ]

Woodworking machinery: Italian exports grow
Published by Mauro Badanelli. .
Internationalisation Industrial equipment Foreign markets Monthly Market Data International marketingNei primi sette mesi del 2026 le esportazioni italiane mostrano un incremento sul 2025, mentre le vendite all'estero dei principali concorrenti calano [ Read all ]

IMF WEO October 2026: Divergent Resilience and Persistent Pressures
Published by Alba Di Rosa. .
Macroeconomic analysis Conjuncture Uncertainty IMF Global economic trendsOn October 13, the International Monetary Fund released its latest World Economic Outlook, a key publication assessing the state of the global economy and its growth prospects. Compared with }... [ Read all ]