World Trade: Increasingly Polarized Growth – July 2026 Update
World trade continues to grow in 2026, but behind the resilience of the aggregate figures, disparities across sectors and geographic regions are widening
Published by Marzia Moccia. .
Conjuncture Foreign markets Uncertainty Global economic trendsDespite a highly uncertain international environment, world trade has not come to a halt. With ExportPlanning data now updated through July, it is possible to confirm that, in the first seven months of 2026, international trade in goods maintained a strong pace of expansion, showing a further relative strengthening.
World trade growth remains above expectations
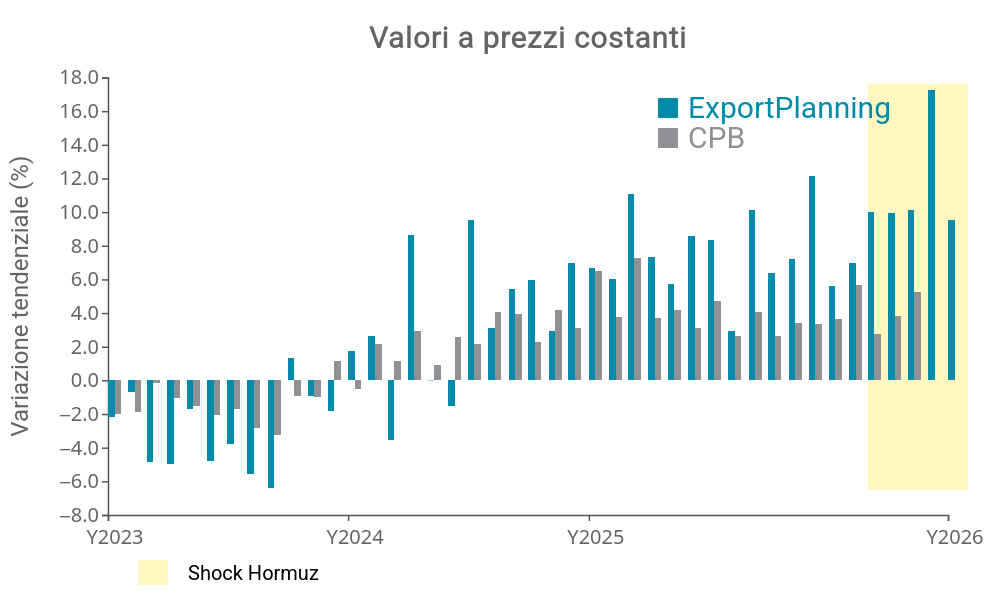
Between January and July 2026, based on ExportPlanning's short-term trade sample, world trade in goods recorded particularly strong growth, reaching 16% in current US dollars and more than 8% at constant prices.
This performance not only confirms the resilience of international trade, but also points to a strengthening compared with the medium-term growth trend in world trade.
Fig.1 - Monthly trade dynamics at constant prices: Jan. 2022 - Jul. 2026
(CPB data vs ExportPlanning data, year-on-year change based on monthly data)
Source: ExportPlanning
The resilience of the overall figure therefore points to a still-dynamic international trade environment. However, the aggregate result tells only part of the story. Beneath the surface of global growth, increasingly polarized dynamics are emerging, both across different product groups and among the main geographical areas.
Increasingly polarized growth
Sectoral polarization: AI investment drives trade growth
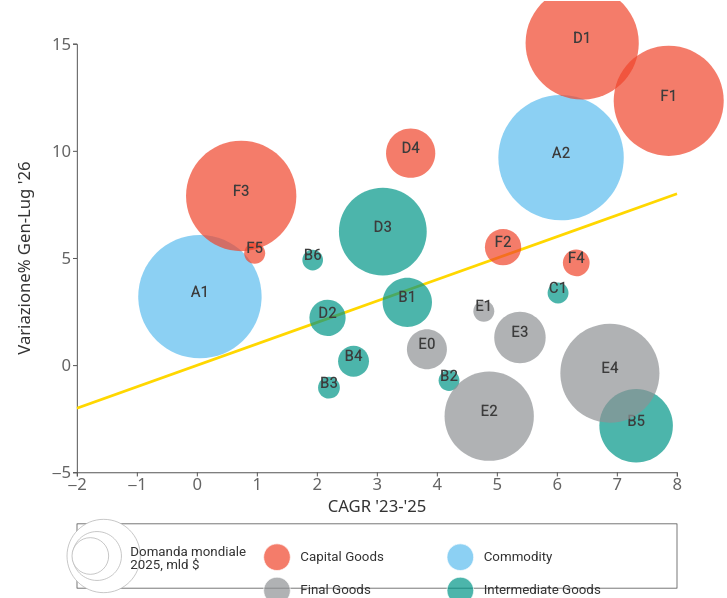
Behind the overall result, some sectors continue to expand at very high rates, while others show signs of stagnation or slowdown. The map below shows the main industries involved in international trade in goods, positioned according to the growth rates at constant prices of imports recorded over the 2023-2025 period (X-axis) and those recorded in the first seven months of 2026 (Y-axis).
This representation provides a concise and immediate view of international demand dynamics, making it possible to identify the most recent patterns and any changes in the pace of expansion compared with the medium-term trend.
The diagonal line (shown in yellow) provides a key interpretative benchmark: industries positioned above the line show a pace of growth that is accelerating compared with the previous two years, while those below the line are experiencing a slowdown; the size of each bubble is proportional to the industry's total trade volume in 2025.
Fig.1 – Map of world demand by industry at constant prices
(year-on-year changes at constant prices, 2023-2025 CAGR vs Jan.-Jul. 2026)
Source: ExportPlanning
Among the different components of world trade, Investment Goods (in orange) show the most significant strengthening of the cycle, with growth reaching 26% at constant prices in the first seven months of 2026. Within this segment, almost all the main product groups are growing faster than in the previous two years, with Machinery (F4) as the only exception.
The contribution to growth, however, remains highly concentrated. Trade is being driven primarily by products related to ICT (F1) and Electronic Components (D1) – including CPUs, processors, semiconductors and digital infrastructure – supported by the rapid expansion of investment in Artificial Intelligence. These are joined by Electrical Engineering (D4), benefiting from growing demand for components and systems for electricity distribution and transformation.
AI, digital infrastructure and electrification therefore emerge as the main drivers of the current investment cycle, through dynamics that are also closely interconnected: the expansion of computing capacity required by AI increases energy demand and, consequently, investment in the infrastructure needed to generate, distribute and transform energy.
Also noteworthy is the strengthening of global demand for Transport Equipment and Motor Vehicles (F3), which extends along the supply chain and also involves the related Components (D3) segment.
At the opposite end of the spectrum are Consumer Goods (in grey). After average annual growth of 6.5% in 2023-2025, the segment recorded a 3.6% decline in the first seven months of 2026. The slowdown is particularly evident in the Healthcare System (E4), following an exceptionally dynamic 2025, and in the Fashion System (E2); the Home System (E3) and Agri-food (E0) remain more resilient, although they too are slowing.
Lastly, Intermediate Goods (in green) show a much more subdued trend, with growth of just +1%.
The gap between the +26% growth in Investment Goods and the -3.6% decline in Consumer Goods effectively captures the nature of the current phase: world trade growth is being driven primarily by technology- and investment-related supply chains, while components more closely linked to traditional demand continue to be affected by international uncertainty.
Geographical polarization: Asia leads growth
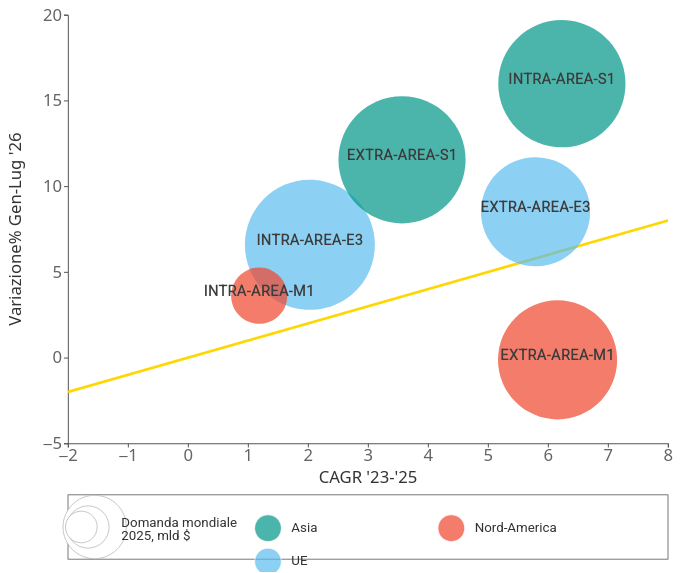
The polarization observed across sectors has an equally clear counterpart in the geography of trade. The following map applies the same analytical framework used for sectors, comparing the dynamics of the world's main trading areas and highlighting which regions are strengthening their cycle relative to the medium-term trend and which, instead, are showing signs of slowdown.
Fig.2 – Map of the world's largest importing areas
(year-on-year changes at constant prices, Jun.-Dec. 2025 vs Jan.-Mar. 2026)
Source: ExportPlanning
The most striking feature is the role of intra-Asian trade (S1), which provides the most significant contribution to growth. Asia's stronger momentum is also closely linked to the sectoral composition of the current expansion: a substantial share of the electronics, semiconductor, ICT and advanced technology supply chains is concentrated in the region. Sectoral and geographical polarization therefore tend to reinforce each other: the very industries currently driving world trade have one of their main production and trade hubs in Asia.
Signs of strengthening are also emerging in European Union demand, supported, among other factors, by Germany's recovery. The dynamics of North America (M1) appear weaker, with trade slowing in an environment shaped by the new US trade policy and its effects on flows with both intra-regional and extra-regional partners.
Conclusions
The concept of polarization therefore provides one of the most effective keys to interpreting the international economic environment in 2026. Behind the overall growth in world trade, economies, sectors and supply chains are moving at very different speeds, with demand becoming increasingly concentrated around specific investment cycles and geographical areas.
What does this mean for exporting companies?
In a highly polarized environment, aggregate figures risk concealing crucial differences. It is therefore increasingly important to identify which supply chains are generating new demand, which markets are benefiting from it and which, instead, are showing signs of slowdown.
The strong growth of ICT, electronics and electrical engineering, for example, shows that opportunities are not limited to producers directly involved in the development of Artificial Intelligence, but can extend throughout the supply chain supporting digital and energy investment.
Similarly, the stronger momentum of Asia reinforces the importance of maintaining a presence in the region's markets and capturing the opportunities generated by an increasingly integrated regional trade network.
For internationalization strategies, the key question is therefore becoming less "how fast is world trade growing?" and increasingly "how is demand evolving in the supply chains and markets that matter to my business?".
ExportPlanning is a Market Intelligence system designed to support companies, consultants, and business associations in analyzing international markets, providing data, reports, and tools to identify the foreign markets with the greatest potential and to monitor and forecast the evolution of markets where they already operate.
>> Learn more
You may be interested in:

IMF WEO October 2026: Divergent Resilience and Persistent Pressures
Published by Alba Di Rosa. .
Macroeconomic analysis Conjuncture Uncertainty IMF Global economic trendsOn October 13, the International Monetary Fund released its latest World Economic Outlook, a key publication assessing the state of the global economy and its growth prospects. Compared with }... [ Read all ]

Hollow glass machinery: global trade set to accelerate in 2026
Published by Mauro Badanelli. .
Industrial equipment Conjuncture Foreign markets Global economic trendsThe global trade in machinery for the production and processing of hollow glass1 has shown a marked reversal in the first seven months of 2026, compared with the weakness that characterised the 2022–2}... [ Read all ]

Machinery: International Sales Results to July 2026
Published by Marcello Antonioni. .
Industrial equipment Conjuncture Monthly Market Data Global economic trendsIn July Machinery exports by EU companies remained in positive territory, but with significant differences across sectors [ Read all ]