Leather goods machinery: Italian leadership in the world trade
Published by Mauro Badanelli. .
Industrial equipment Conjuncture Foreign markets International marketingThe international trade fair for machinery and technologies for footwear, leather goods and tanning, Simac Tanning Tech, will take place from September 15 to 17 at the Rho Fiera exhibition centre, bringing together leading companies from the industry from around the world. The event provides an opportunity to analyse developments in the leather goods machinery sector, where Italy is a leader in both production and exports.
Leather goods machinery (HS code 845380) represents the technological core of the global luxury and high-value fashion accessories industry. In a rapidly evolving manufacturing landscape, the ability to combine high-end craftsmanship with Industry 4.0 paradigms has become essential to maintaining competitiveness in international markets. Digital transformation, focused on end-to-end traceability and process customisation, is no longer merely a technical option, but a strategic imperative. In this context, Italy plays a central role: Made in Italy is not limited to supplying capital goods, but has established itself as a provider of integrated system solutions.
Despite aggressive global competition, the Italian model demonstrates greater resilience thanks to a technological advantage that clearly differentiates leather goods manufacturing from less specialised manufacturing sectors. The strength of this positioning emerges from an analysis of global trade in the sector, based on data available in the ExportPlanning information system.
Global trade in the sector grows over the long term
The global leather goods machinery market showed a structurally positive growth trajectory over the 2009-2025 period. At the end of 2025, total international trade amounted to €83.9 million, with a nominal compound annual growth rate (CAGR) of +2.3%.
Fig.1 – Leather goods machinery - Global trade
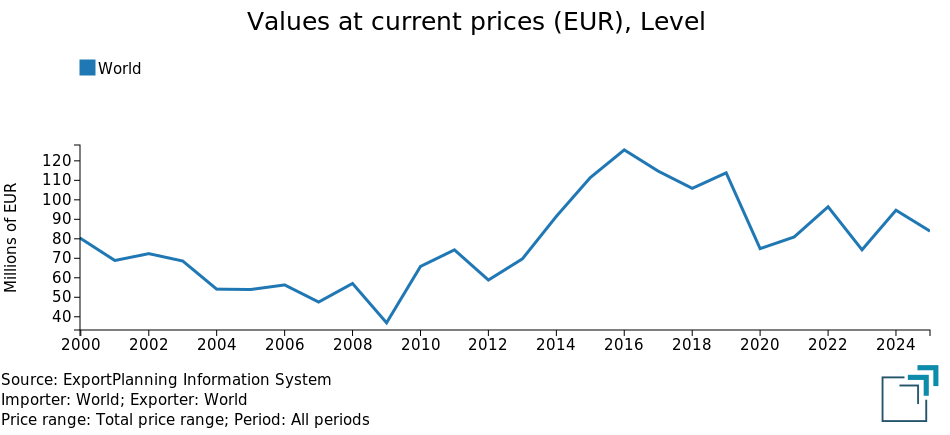
Fig. 1 shows how international trade declined following the pandemic year of 2020. A granular analysis of the post-pandemic period (2020-2025) highlights a significant divergence between nominal and real dynamics, net of inflationary and exchange-rate effects. While global trade grew at an average annual rate of +2.3% in nominal terms, at constant prices it contracted, closing the five-year period with a CAGR of -3.0%. This divergence reflects the general increase in production costs, freight rates and global inflation.
Demand shifts towards the East
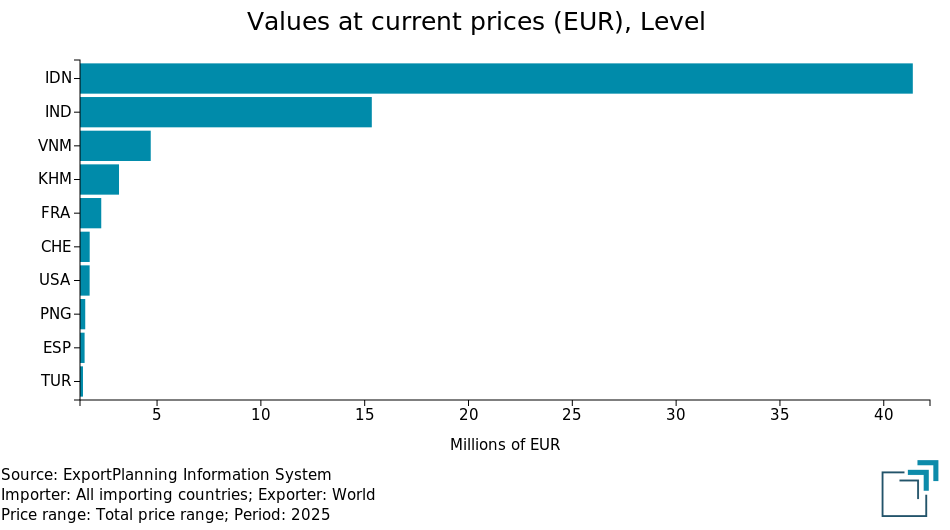
The 2025 geographical mapping confirms the consolidation of Asian production clusters as drivers of technology demand. Industrial concentration in specific areas has transformed Asia into the centre of global machinery import demand.
2025 data highlight the following leading markets:
- Indonesia: the world's leading market, with imports worth €41.4 million and a market share of 40.3%1.
- India: a market to be closely monitored, with imports worth €15.3 million (14.9%).
- Vietnam: a key hub for regional supply chains, with imports worth €4.7 million and a market share of 4.6%.
- Cambodia: an emerging hub, with imports worth €3.2 million (3.1%).
In this Asia-driven scenario, France represents the only significant European exception (€2.3 million, 2.2%). France's relevance can also be understood in light of the presence of major luxury groups and high-end manufacturers in the country, characterised by high requirements in terms of technology, automation and process control.
The comparative analysis of sector import data between 2015 and 2025 is also particularly interesting, highlighting a profound restructuring of the machinery demand map, with the strengthening of Asian hubs. In summary, the 2015-2025 decade saw a strong concentration of demand in Indonesia and India, a sharp reduction in purchases by Vietnam, and the exit of European countries such as Belgium, Slovakia and Poland from the group of leading markets.
Fig. 2 – Leather goods machinery - Main markets
2015
2025

Interested in receiving a selection of the most relevant news of the week on international trade? Subscribe for free to World Business Newsletter!
The global competitive landscape: Italy maintains its leadership
The leather goods machinery sector sees Italy leading global trade, with exports worth €26.4 million in 2025, corresponding to a 31.0% share. It is followed by Taiwan (26.2%) and China (16.6%).
Italy's leadership is particularly significant when considered not only in terms of its share of global exports, but also in light of its positioning in higher price segments and its ability to serve markets characterised by high technological standards.
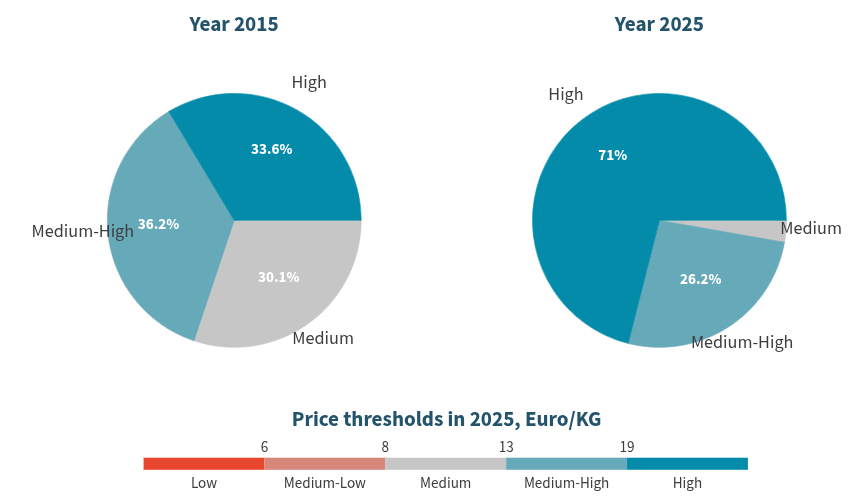
In 2025, the high-end (71%) and upper-middle (26%) segments predominated in the composition of Italian exports, confirming the high technological standard of Italian manufacturers' offerings. The comparison with 2015 also highlights the ability of Italian companies to strengthen their positioning in higher-value product segments.
Fig. 3 - Leather goods machinery - Italy - Export distribution by price level
Source: ExportPlanning calculations - Reporting Tool
Italy's premium positioning is confirmed by its leading position in European markets such as France, Spain, Poland, Portugal and the United Kingdom. This confirms the strength of the Italian model in providing solutions for segments where added value is the key purchasing driver.
Short-term dynamics: signs of recovery in the first half of 2026
The first half of 2026 delivered a clear signal of a strong recovery in the sector, with growth of +23.3% in value and +12.6% in volume.
Tab. 1 - Leather goods machinery - Global trade dynamics for the main exporting countries (current values)
| Rank | Country | Exports 2025 € Mln |
CAGR 2022-2025 |
Year-on-year change H1-2026 |
|---|---|---|---|---|
| 1 | Italy | 26.4 | - 15.7% | + 14.2% |
| 2 | Taiwan | 22.3 | + 8.3% | - 65.6% |
| 3 | China | 14.1 | - 0.1% | + 19.2% |
| 4 | Romania | 3.3 | + 85.0% | + 330.9% |
| 5 | South Korea | 2.6 | + 91.4% | - 65.3% |
Source: ExportPlanning calculations
The short-term analysis nevertheless reveals sharply divergent performances. While Italy (+14.2%) and China (+19.2%) are recovering strongly, there has been a sharp collapse in the Taiwan (-65.6%) and South Korea (-65.3%) hubs. The case of Romania is particularly significant: with a +330.9% increase in the first half of 2026 and a CAGR of 85% over 2023-2025, the country is no longer a statistical anomaly but is emerging as a new, aggressive manufacturing hub in the heart of Europe.
Conclusions
Global trade in leather goods machinery confirms a sector characterised by high technological content and an increasingly complex competitive landscape. Italy maintains a leadership position, supported by strong international positioning, but China's growing ability to compete also in higher-value segments and the emergence of new manufacturing hubs, such as Romania, indicate that this advantage cannot be taken for granted.
The recovery recorded in the first half of 2026 also highlights a far from uniform dynamic: for Italian companies in the sector, it is therefore increasingly important not to limit themselves to monitoring overall market performance, but to identify promptly where demand is growing and how the competitive landscape is changing.
In this context, systematic monitoring of trade flows through ExportPlanning can support companies across both dimensions: on the one hand, by analysing competitors, their market shares and positioning across different markets; on the other, by identifying the fastest-growing markets and interpreting trends in global demand.
From this perspective, ExportPlanning international trade data make it possible to continuously monitor the evolution of markets and competitors, combining structural analysis of trade flows with observation of the latest dynamics. Monitoring this information can support companies in identifying market opportunities and assessing changes in the competitive landscape, providing a quantitative basis for guiding internationalisation strategies.
1 The statistical discrepancy is excluded from the calculation of market shares.
You may be interested in:
THE EU EXPORTS OF CAPITAL GOODS IN Q3-2026
Published by Marcello Antonioni. .
Metal industry Conjuncture Export Global economic trendsThe growth in European sales of capital goods (+6.9% year-on-year in euro) was driven by Tools and Equipment for ICT and Services and Electrical Engineering [ Read all ]
Woodworking machinery: Italian exports grow
Published by Mauro Badanelli. .
Internationalisation Industrial equipment Foreign markets Monthly Market Data International marketingNei primi sette mesi del 2026 le esportazioni italiane mostrano un incremento sul 2025, mentre le vendite all'estero dei principali concorrenti calano [ Read all ]

IMF WEO October 2026: Divergent Resilience and Persistent Pressures
Published by Alba Di Rosa. .
Macroeconomic analysis Conjuncture Uncertainty IMF Global economic trendsOn October 13, the International Monetary Fund released its latest World Economic Outlook, a key publication assessing the state of the global economy and its growth prospects. Compared with }... [ Read all ]