The most dynamic markets for Italian woodworking machinery
Published by Mauro Badanelli. .
Industrial equipment International marketingAs already discussed in a previous article, Italy is a reference player in the woodworking machinery sector for the breadth and quality of its technological offering.
In particular, for the following types of stationary machinery, Italy has established itself among the world leaders both in terms of production and exports:
- Machining centres (HS code 846520);
- Multi-operation machines (HS code 846510);
- Presses for the manufacture of particle board or fibre board of wood or other ligneous materials (HS code 847930).
Fig.1 - Italian Exports of Stationary Woodworking Machinery
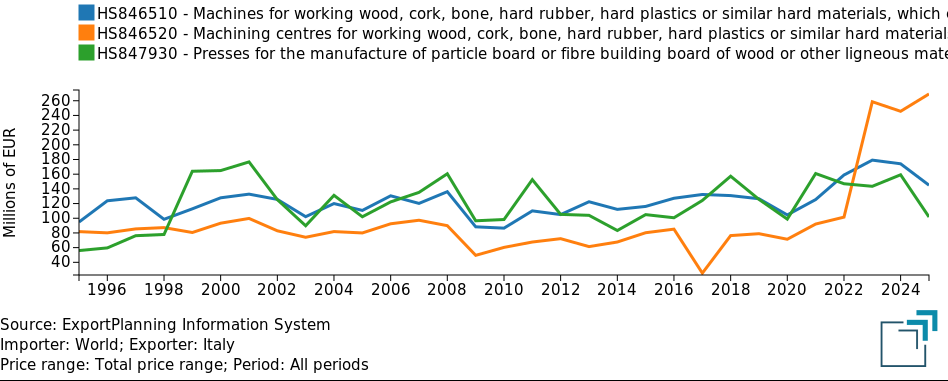
Source: ExportPlanning
In particular, in machining centres Italy leads international trade with a 39% share and exports of 269 million euros, ahead of Germany (31%). In multi-operation machines, Italy is the second largest exporter worldwide with a 14% share and foreign sales of approximately 145 million euros, while Germany dominates the segment with 53% of the market. In the panel presses segment as well, the Italian industry ranks among the main global players, with 16% of international trade and exports of 102 million euros, behind Germany and China.
What are today's most dynamic and promising international markets for Italian producers of these types of woodworking machinery?
Using the ExportPlanning information system, we analyse the dynamics of the main markets for the aforementioned types of woodworking machinery for the three-year period 2023–2025 and the insights relating to the first three months of 2026, focusing the analysis on Italy's positioning in these markets.
Machining Centres
In the three-year period 2023–2025, import flows for machining centres showed different dynamics across key markets. France remains the primary destination market (52.1 million euros in 2025), despite a slight decline over the three years (CAGR -4.4%). However, Q1-2026 marks a sharp recovery with growth of 18.3%. The United States suffered a sharp contraction over the three years (-19.8% CAGR), a trend that intensified in Q1-2026 with a 40.2% drop in euros compared to the same period in 2025.
Germany and Poland show the most positive trends. For Germany, imports grew by 7.4% over the three-year period and accelerated in Q1 2026 (+21.8%). Poland stands out for structural import growth of 15.6% (2023–2025) and a further acceleration in Q1-2026 (+83.9%). In these markets, Italy is not only the leading supplier but has often increased its penetration compared to previous years.
Spain showed the strongest import growth over the three-year period among the main markets (+24.8%), although the start of 2026 indicates a slowdown (-9.8%). Among the sector's emerging markets, the three-year performances of China (CAGR +22.1%), Brazil (+30.4%) and Turkey (+23.7%) stand out. China and Brazil then experienced a sharp halt in imports in Q1 2026, while Turkey saw a significant increase, similar to Romania.
Tab. 1 - Machining Centres - World Trade Dynamics by Importing Country
| # | Country | Import 2025 (€ mln) |
Italian Export 2025 (€ mln) |
Var. % in euros | |
|---|---|---|---|---|---|
| CAGR 2025/2023 |
Q1-2026 | ||||
| 1 | France | 52.1 | 37.3 | -4.4 | +18.3 |
| 2 | United States | 36.7 | 25.4 | -19.8 | -40.2 |
| 3 | Germany | 36.6 | 27.8 | +7.4 | +21.8 |
| 4 | Poland | 35.3 | 18.7 | +15.6 | +83.9 |
| 5 | Switzerland | 29.7 | 5.3 | +19.0 | -12.7 |
| 6 | Spain | 26.6 | 24.1 | +24.8 | -9.8 |
| 7 | United Kingdom | 19.5 | 5.6 | -15.0 | -39.7 |
| 8 | Canada | 16.1 | 6.1 | 3.0 | -10.8 |
| 9 | China | 15.7 | 8.3 | +22.1 | -75.0 |
| 10 | Belgium | 15.3 | 7.0 | -7.5 | -47.0 |
| 11 | Brazil | 13.5 | 4.8 | +30.4 | -38.2 |
| 12 | Turkey | 12.8 | 6.7 | +23.7 | +40.6 |
| 13 | Romania | 12.7 | 5.7 | +4.3 | +41.6 |
| 14 | Japan | 11.5 | 2.0 | -20.2 | +3.9 |
| 15 | Czech Republic | 10.4 | 6.3 | +1.0 | -43.6 |
Source: ExportPlanning elaborations
Multi-Operation Machines
The performance of global markets for multi-operation machines shows contrasting dynamics between the three-year period 2023–2025 and the start of 2026, with Italy maintaining a significant positioning concentrated in the high-price segment.
In particular, in the three-year period 2023–2025, market trends show strong heterogeneity. The United States remains the main market in terms of imports (108 million euros in 2025), despite a negative trend over the three years (CAGR 2023–25: -6%), which subsequently intensified in Q1 2026 (-31.4% year-on-year in euros). Switzerland and Germany stand out as counter-trend markets, and therefore growing. Switzerland showed an average annual import growth rate of +49.5%, maintaining a positive sign at the start of 2026 (+7.2%). Germany accelerated, moving from a CAGR of +13.6% to +18.2% in Q1-2026.
China recorded import growth over the three years (CAGR 2023–25: +152.1%), but suffered a sharp decline in first quarter 2026 (-71.6%), signalling high volatility. In addition to China, severe contractions in Q1 2026 imports occurred in Brazil (-65.5%) and Canada (-46.0%). Conversely, imports by Australia and Turkey increased (by +20.8% and +7.1% respectively).
Tab. 2 - Multi-Operation Machines - World Trade Dynamics by Importing Country
| # | Country | Import 2025 (€ mln) |
Italian Export 2025 (€ mln) |
Var. % in euros | |
|---|---|---|---|---|---|
| CAGR 2025/2023 |
Q1-2026 | ||||
| 1 | United States | 108.4 | 24.6 | -6.0 | -31.4 |
| 2 | Switzerland | 48.4 | 0.8 | +49.5 | +7.2 |
| 3 | Germany | 41.1 | 2.9 | +13.6 | +18.2 |
| 4 | France | 40.8 | 7.1 | -3.7 | -22.3 |
| 5 | Poland | 38.2 | 8.1 | +6.1 | -20.2 |
| 6 | Canada | 37.3 | 1.4 | -5.3 | -46.0 |
| 7 | China | 35.3 | 8.0 | +152.1 | -71.6 |
| 8 | United Kingdom | 35.0 | 1.9 | -0.5 | -19.7 |
| 9 | Brazil | 30.1 | 9.3 | +22.5 | -65.5 |
| 10 | Australia | 22.3 | 1.2 | -29.2 | +20.8 |
| 11 | Netherlands | 21.9 | 0.3 | +27.1 | -34.5 |
| 12 | Austria | 21.3 | 1.1 | -11.3 | -32.6 |
| 13 | Turkey | 19.2 | 2.7 | +0.3 | +7.1 |
| 14 | Sweden | 16.7 | 1.1 | +36.3 | -75.6 |
| 15 | Spain | 14.9 | 6.2 | -6.3 | +253.0 |
Source: ExportPlanning elaborations
Presses
Similarly to the previous segments analysed, in the presses segment too, imports in the main global markets show an extremely heterogeneous dynamic, with some markets in accelerated expansion and others in sharp contraction.
India is the world's leading market in 2025 with 53.3 million euros, despite a three-year period 2023–2025 characterised by an average annual decline of 34.9%. However, Q1 2026 signals a strong recovery (+97.6%). The second market is the United States (43.8 million euros), which showed solid growth over the three years (+26.8%) and maintains a positive, though slower, trend at the start of 2026 (+4.1%). Thailand, the third largest global importer (41.1 million euros), recorded significant growth over the three years (CAGR: +151.1%), confirming its dynamism in Q1-2026 as well (+33.6%).
Chile represents the most striking case of expansion. With a value of 35.8 million euros in 2025, its imports posted a three-year CAGR of +205.9% and an even sharper acceleration in Q1-2026.
Among other major markets, Switzerland is very dynamic, with imports growing at an average annual rate of 166% over the 2023–2025 three-year period before experiencing a sharp slowdown in Q1 2026 (-47.1%). Other markets such as Canada and Turkey suffered heavy import contractions over the three years, a trend that continues in 2026. Particularly interesting is the import trend in Bulgaria, which grew at an annual rate of 48% over the 2023–2025 three-year period, with a sharp acceleration recorded in Q1 2026.
Tab. 3 - Presses - World Trade Dynamics by Importing Country
| # | Country | Import 2025 (€ mln) |
Italian Export 2025 (€ mln) |
Var. % in euros | |
|---|---|---|---|---|---|
| CAGR 2025/2023 |
Q1-2026 | ||||
| 1 | India | 53.3 | 0.3 | -34.9 | +97.6 |
| 2 | United States | 43.8 | 7.6 | +26.8 | +4.1 |
| 3 | Thailand | 41.1 | 1.5 | +151.1 | +33.6 |
| 4 | Chile | 35.8 | 0.0 | +205.9 | +628.6 |
| 5 | Switzerland | 29.6 | 10.9 | +166.3 | -47.1 |
| 6 | Indonesia | 23.9 | 0.0 | -14.7 | -54.2 |
| 7 | France | 17.1 | 6.7 | +15.7 | -72.4 |
| 8 | Spain | 14.8 | 12.5 | -20.1 | -55.3 |
| 9 | Turkey | 14.6 | 0.4 | -59.8 | -58.0 |
| 10 | Canada | 13.1 | 3.8 | -47.8 | -73.3 |
| 11 | United Kingdom | 12.5 | 1.7 | +2.9 | -56.6 |
| 12 | Slovakia | 12.2 | 0.0 | -23.8 | +127.8 |
| 13 | Germany | 8.0 | 11.7 | -33.7 | -1.7 |
| 14 | Croatia | 7.4 | 0.2 | -18.4 | -97.7 |
| 15 | Bulgaria | 7.3 | 0.2 | +48.0 | +132.1 |
Source: ExportPlanning elaborations
Conclusions
The analysis of the main markets for the three types of machinery in which Italy plays a dominant role shows that international trade is marked by strong volatility, especially with regard to markets in the American and Asian area. Import dynamics are, however, more solid in EU markets. Italy can therefore strengthen its presence in European markets and its positioning in the Premium segment to maintain technological leadership and drive sector growth.
For Italian suppliers of woodworking technologies, it is nonetheless important to closely monitor emerging markets as well (such as Chile and Thailand in the presses segment) which are showing signs of strong dynamism in the early months of 2026 and appear increasingly receptive to a quality offering that rewards Italy.
You may be interested in:

Hollow glass machinery: global trade set to accelerate in 2026
Published by Mauro Badanelli. .
Industrial equipment Conjuncture Foreign markets Global economic trendsThe global trade in machinery for the production and processing of hollow glass1 has shown a marked reversal in the first seven months of 2026, compared with the weakness that characterised the 2022–2}... [ Read all ]

Machinery: International Sales Results to July 2026
Published by Marcello Antonioni. .
Industrial equipment Conjuncture Monthly Market Data Global economic trendsIn July Machinery exports by EU companies remained in positive territory, but with significant differences across sectors [ Read all ]

Leather Machinery: After the 2026 Downturn, the Outlook for World Trade in 2027-2028
Published by Mauro Badanelli. .
Industrial equipment Forecast International marketing2026 is shaping up to be a year of contraction in world trade of machinery for the manufacture or repair of leather or hide articles (HS845380), following the levels reached in 2025. According to Expo}... [ Read all ]