Global trade in footwear machinery: China dominates, Italy leads the way in premium technology
Published by Mauro Badanelli. .
Industrial equipment Conjuncture Foreign markets International marketingThe footwear machinery industry represents one of the pillars of manufacturing innovation in the fashion sector. In an increasingly competitive environment, characterized by global markets, growing attention to sustainability, and digital transformation, technology manufacturers are required to develop solutions capable of combining productivity, quality, and flexibility.
From automated cutting machines to stitching systems, from lasting technologies to assembly and finishing equipment, up to the latest applications in robotics, artificial intelligence, and Industry 4.0, the sector continues to evolve to meet the needs of manufacturers seeking increasingly efficient and customizable production processes.
Italy stands out for its ability to combine innovation, manufacturing quality, and engineering know-how, elements that have made Made in Italy an international benchmark in the premium segment of the market. However, the international landscape is becoming increasingly competitive, especially with China's emergence as the dominant player in the industry. Therefore, the analysis of global trade provides a privileged indicator of the overall health of the manufacturing supply chain and the dynamics currently shaping the market.
International trade grows over the long term
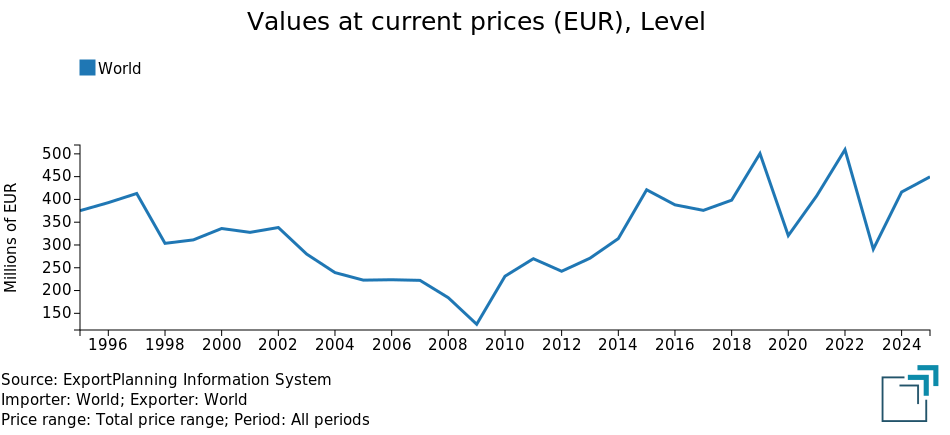
Global trade in footwear machinery (HS code 845320) reached €449.6 million in 2025. The historical evolution of the sector shows a phase of expansion between 2009 and 2025, with a compound annual growth rate (CAGR) of +5.4% at current prices. More recent developments, however, have been negative, with a 2022–2025 CAGR of -4.1%, mainly due to the sharp slowdown in international trade recorded in 2023.
Measured at constant prices, that is, excluding the effects of inflation and exchange rate fluctuations1, the picture is quite different. Between 2022 and 2025, global trade in the sector recorded an average annual growth rate of +4.2%. This divergence from the current-price data highlights that the contraction in the nominal value of trade was mainly driven by price developments and monetary variables, while the real dynamics of trade remained positive.
Fig. 1 – Footwear Machinery - Global trade
Asia is the driving force of global demand in the sector
The analysis of footwear machinery imports highlights the overwhelming dominance of Asian countries as destination markets for the industry.
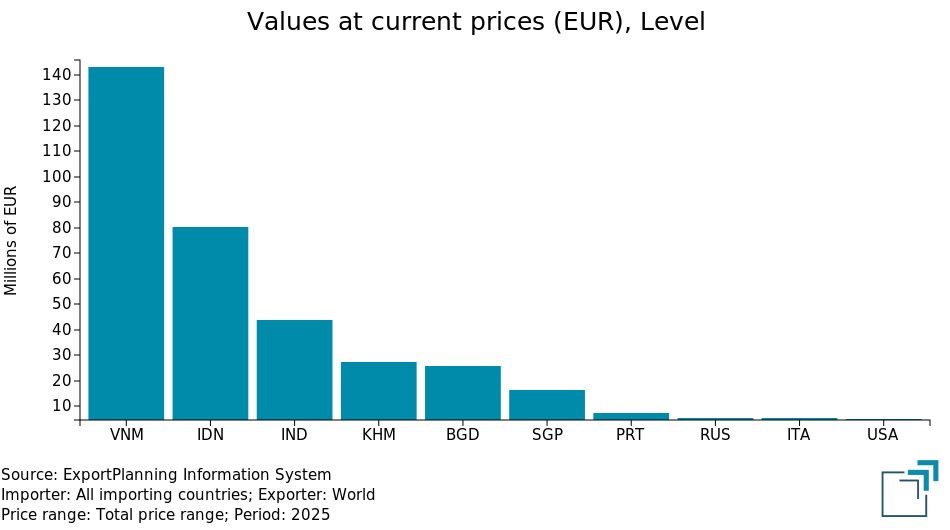
Vietnam confirmed its position as the world's leading importer in 2025, with imports worth €142.9 million, accounting for 32.7% of the global market. It is followed by Indonesia, the second-largest market in 2025, with imports of €80.2 million and an 18.3% market share, and India, ranking third with imports worth €43.9 million and a 10.0% market share.
Completing the list of the world's top five destination markets are Cambodia, which imported footwear machinery worth €27.2 million in 2025 (6.2% market share), and Bangladesh, with imports totaling €25.8 million and a 5.9% market share.
Fig. 2 – Footwear Machinery - Major markets (2025)
Interested in receiving a selection of the week's most relevant international trade news? Subscribe free to the World Business Newsletter!
China dominates the competitive landscape, but Italy remains the second-largest exporter
On the export side, supply is dominated by a small number of major players. China is the undisputed leader, with exports worth €331.4 million and a 69.3% global market share in 2025. Italy confirms its position as the world's second-largest exporter (9.3% market share, equivalent to €44.5 million), followed by Taiwan (5.8%) and South Korea (3.4%).
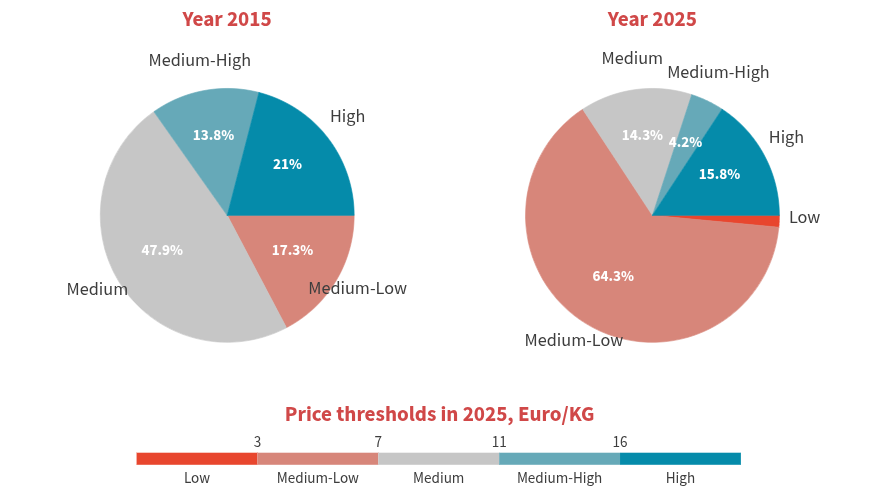
As China strengthened its position as the leading technology supplier to the footwear industry between 2015 and 2025, the market structure changed dramatically. The Lower Mid-range price segment became the dominant category, expanding from 17.3% to as much as 64.3% of total trade, at the expense of the Mid-range segment, whose share fell sharply from 47.9% to 14.3%. Likewise, the High-end segment declined from 21.0% in 2015 to 15.8% at the end of the period.
Fig. 3 – Footwear Machinery - Global trade distribution by price range
Source: ExportPlanning elaborations - Reporting Tool
China is the dominant supplier in almost every market, with extremely high levels of concentration in countries such as Cambodia (97.9% market share) and Russia (99.7%).
Italy continues to be a key partner for markets demanding high-end technology. It is the leading supplier in Portugal (63.6% market share) and the second-largest supplier in strategic markets such as India (12.0%) and the United States (33.1%).
The analysis of the 2022–2025 period for the world's leading exporters highlights a challenging phase for the footwear machinery industry, with almost all major suppliers recording negative growth rates. The decline was relatively limited for China and Germany. By contrast, Slovakia stands out as a remarkable exception, posting a compound annual growth rate at current prices of more than 300%.
Finally, the analysis of the first half of 2026, based on preliminary estimates of international trade data for the second quarter of 2026, confirms a phase of widespread contraction among the world's leading exporters of footwear machinery.
Almost all of the major exporting countries show signs of weakness, with declines that are often in the double digits compared with the January–June 2025 period. In particular, China experienced a sharp slowdown, with exports falling by 38.3%. An even steeper decline was recorded by South Korea (-46.4%). Among the world's top five exporters, Taiwan and Italy recorded the smallest decreases, at -5.1% and -11.0%, respectively.
In contrast with the overall trend, some smaller exporting countries, such as Slovakia and Romania, recorded significant export growth during the first half of 2026.
Table 1 – Footwear Machinery - Global trade dynamics of the main exporting Countries
(current prices)
| Rank | Country | 2025 Exports € million |
CAGR 2022–2025 |
Year-on-year Change H1-2026E |
|---|---|---|---|---|
| 1 | China | 331.4 | -2.7% | -38.3% |
| 2 | Italy | 44.5 | -10.9% | -11.0% |
| 3 | Taiwan | 27.5 | -23.0% | -5.1% |
| 4 | South Korea | 16.4 | -18.9% | -46.4% |
| 5 | Germany | 13.1 | -1.4% | -29.9% |
Source: ExportPlanning elaborations
Conclusions
Global trade in footwear machinery confirms a structural shift toward Asia, with Vietnam, Indonesia, and India leading global demand, while Italy and Portugal are affected by the relocation of manufacturing capacity to the Far East. The growing concentration in the lower mid-range price segment primarily benefits Chinese manufacturers, whose products now dominate almost every market in terms of market share.
Against this backdrop, Italy's ability to maintain its position as the world's second-largest exporter confirms its strong niche positioning in the high-end technology segment. Italian machinery remains the preferred choice in markets where the footwear industry competes through quality and innovation rather than production volumes, as demonstrated by Italy's leading role in Portugal and its strategic partnerships in India and the United States.
However, the simultaneous decline recorded by the world's five leading exporters during the first half of 2026 deserves close attention. The ability to differentiate through quality, technological innovation, and advanced manufacturing solutions will remain the key factor enabling Italian manufacturers to defend their market share in an industry where competition on volumes is now overwhelmingly dominated by China.
1) In the ExportPlanning Information System's Global Economic Outlook database, the indicator Quantity at Constant Prices (Q) has been developed. This indicator is obtained through a deflation process, whereby the historical series of monetary values (V) is converted into an equivalent series expressed at constant prices using a selected base year.
You may be interested in:

Hollow glass machinery: global trade set to accelerate in 2026
Published by Mauro Badanelli. .
Industrial equipment Conjuncture Foreign markets Global economic trendsThe global trade in machinery for the production and processing of hollow glass1 has shown a marked reversal in the first seven months of 2026, compared with the weakness that characterised the 2022–2}... [ Read all ]

Machinery: International Sales Results to July 2026
Published by Marcello Antonioni. .
Industrial equipment Conjuncture Monthly Market Data Global economic trendsIn July Machinery exports by EU companies remained in positive territory, but with significant differences across sectors [ Read all ]

World Trade: Increasingly Polarized Growth – July 2026 Update
Published by Marzia Moccia. .
Conjuncture Foreign markets Uncertainty Global economic trendsWorld trade continues to grow in 2026, but behind the resilience of the aggregate figures, disparities across sectors and geographic regions are widening [ Read all ]