Global Economic Outlook: International Trade Results for April 2026
The expansionary phase of world trade is strengthening, despite significant differences at sector level
Published by Marzia Moccia. .
Conjuncture Industries Uncertainty Global economic trendsApril 2026 Trade Results for Total Goods
As part of the monthly update of the Export Planning Information System (covering world trade for over 5,500 products, 3,000 strategic business areas, 220 sectors, and 20 industries), the April 2026 data signal the continuation of a strong growth trend in world trade in goods.
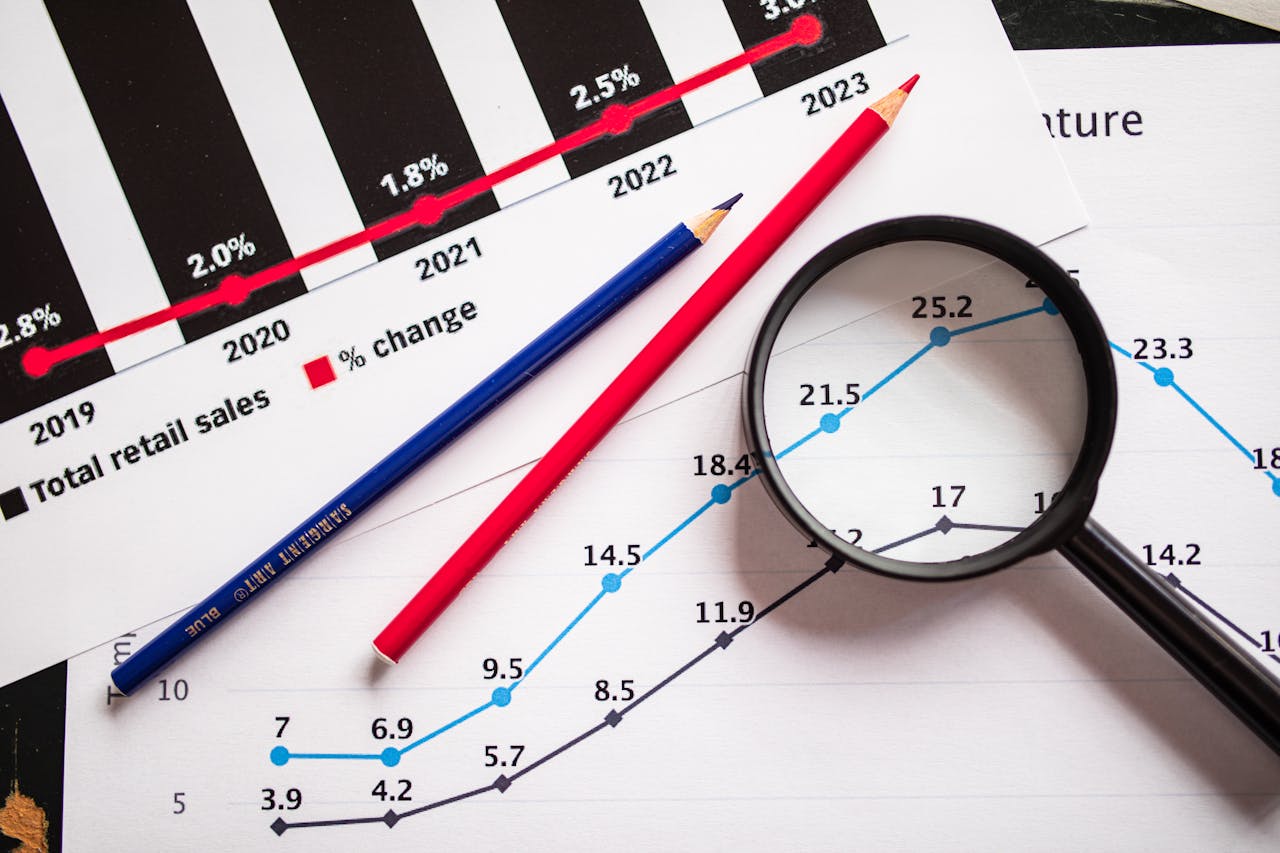
In April, world trade in goods grew by 14% in dollars, equivalent to a change in real terms (constant prices)1 of over 10%.
Extending the analysis period to the January-April 2026 interval, real trend growth stands at +8.2%, confirming the consolidation of a particularly favorable trend.
World Trade of Total Goods:
Year-over-Year changes
| Total Goods | April 2026 | Jan-Apr 2026 |
| in dollars | +14.0% | + 10.8% |
|---|---|---|
| at constant prices | +10.0% | + 8.2% |
Source: ExportPlanning - Monthly Trade Data
April 2026 Trade Results by Product Category
The sectoral breakdown of global demand appears particularly significant.
An analysis of international trade data for the first four months of the year, expressed at constant prices and therefore net of price effects, highlights widespread growth dynamics across the various product sectors, but with varying intensity for the various industries that drive global trade:
- on the decline front, the persistent weakness of the Fashion industry stands out, which contracted by -17.7% in April, bringing the cumulative decline for the January-April period to -24.7%. The Chemicals and Pharmaceuticals industry is also in negative territory (-4.9% in April and -8.8% cumulatively), signaling a slowdown after the particularly favorable performances recorded last year;
- positive signs emerge from the Raw Materials (+4.9% and +8% respectively), an industry that continues to benefit from the expansionary phase of global trade, from the Home & Furnishings (+7.6% and +4.8% respectively) and, above all, from the Metalworking & Mechanical Engineering (+25.7% and +21.4% respectively);
- growth in the Agri-food, which recorded increases of less than 2% both in April and in the cumulative period for the first four months of the year, confirming substantially stable demand dynamics.
Overall, growth in world trade in goods (+10% in April and +8.2% in the January-April 2026 period) appears to be driven primarily by capital goods, while consumer goods, particularly the fashion system, continue to show signs of greater fragility.
World Trade by Macrosectors:
Year-over-Year changes at constant prices
| Macrosectors | April 2026 | Jan-Apr 2026 |
| Raw Materials | + 4.9% | + 8.8% |
|---|---|---|
| Agri-food | + 1.9% | + 1.8% |
| Fashion | -17.7% | -24.7% |
| Home & Furnishings | + 7.6% | + 4.8% |
| Chemical & Pharmaceutical | - 4.9% | - 8.8% |
| Metalworking & Mechanical Engineering | +25.7% | +21.4% |
| TOTAL GOODS | +10.0% | + 8.2% |
Source: ExportPlanning - Monthly Trade Data
Leading and Lagging Industries
In particular, in the first four months of 2026, the sectoral picture of world trade highlights the following cumulative trend performances measured at constant prices:
- leading industries:
- in the Metalworking Industry: Electronic Components (+43.0%), Tools and Equipment for ICT and Services (+36.7%), Machinery (+30.7%) [thanks, above all, to the boost from demand for machinery for semiconductors], Industrial Engineering (+20.3%);
- in the Raw Materials supply-chain: Industrial Commodities (+15.2%);
- in the Home/Furniture supply-chain: Finished products for the home (+9.0%);
- lagging industries:
- in the Fashion supply-chain: Finished products for the personal use (-25.0%) and Intermediate goods in textiles and leather (-22.0%);
- in the Chemicals supply-chain: Non-food consumer goods (-15.2%) and Chemical intermediate goods (-10.3%).
Conclusions
The April 2026 data confirm and strengthen the expansionary phase in world trade that began in previous months. Real monthly growth of +10% and +8.2% cumulative growth for January-April paints an overall positive picture, driven primarily by demand for capital goods.
The metalworking sector remains the main driver of global growth, with performances unmatched among major industries: electronic components (+43%), ICT tools and equipment (+36.7%), and machinery for industrial processes (+30.7%) demonstrate how digital transformation and the modernization of production systems continue to generate sustained international demand. The home/furniture sector and industrial raw materials also offer encouraging signs, albeit at more moderate levels.
On the other hand, structural critical issues remain that deserve attention. The fashion/personality sector recorded a cumulative decline of nearly 25 percentage points in the first four months of the year, a contraction that goes well beyond economic volatility and suggests a deeper repositioning of global demand. Even the chemical-pharmaceutical sector, after its exceptional performance in 2025, is showing signs of a downward trend.
Overall, the picture emerging for the first months of 2026 is one of expanding but increasingly selective global trade: sectors linked to industry, technology, and productive investment are growing, while those more exposed to final consumer demand are slowing or declining.
For Italian exporting companies, this sectoral bifurcation represents both an opportunity—for those operating in metalworking, plant engineering, and capital goods—and a sign of caution for consumer-oriented sectors, which are being called upon to reconsider positioning strategies and outlet markets in light of structurally more selective international demand.
With the aim of enabling constant monitoring of key foreign markets at a product-specific level, ExportPlanning offers the Customs Declaration Database service, an "on-demand" supply of monthly market data, customizable at the level of customs codes and markets of interest.
1) In the World Trade Dataset of the ExportPlanning Information System, the measure Quantities at constant prices (Q) has been constructed. This measure incorporates a deflation process, whereby the historical series of monetary values (V) has been transformed into a corresponding series expressed at constant prices, with reference to a specific year, known as the base year. For a description of the methodology applied, see the Methodological Note of the World Trade Dataset.
You may be interested in:

Plastics processing machinery: what are the main markets and how is the competitive landscape evolving?
Published by Mauro Badanelli. .
Industrial equipment Conjuncture Industries International marketingPlastic processing machinery represents one of the most important technological pillars of modern manufacturing supply chains. Through processes such as injection moulding, extrusion, blow moulding }... [ Read all ]

China’s Foreign Trade, April 2026: Chips, Gold and New Geographies of Value Chains
Published by Luca Surace. .
Conjuncture Global economic trendsAn analysis of China’s monthly foreign trade data updated to April 2026 [ Read all ]
Previsioni di commercio mondiale: incertezza sistemica e dinamiche selettive di crescita
Published by Marzia Moccia. .
Total goods Global demand Forecast Foreign markets Uncertainty Foreign market analysisThe conflict in the Middle East is testing the resilience of the global economy, which so far has been supported by relatively favourable financial and fiscal conditions and by growing demand for tech}... [ Read all ]