Food Machinery: Leading and Lagging World Markets in Q2 2026
In Q2 2026 world trade of Food Machinery grew for the 14th consecutive quarter, but with markets that are quite polarized.
Published by Marcello Antonioni. .
Industrial equipment Conjuncture Export markets Uncertainty Global economic trendsSector Performance in Q2 2026
The availability in ExportPlanning of preliminary estimates for international trade data for the 2nd quarter of 2026 (covering over 5,500 products, 3,000 strategic business areas, 220 sectors, and 20 industries) makes it possible to document the continuation of the growth phase in global trade of Food processing Machinery1, which — measured at constant prices (net of inflationary and exchange-rate effects)2 — showed a year-on-year increase of +5.4%, following +11.7% in the first quarter of the year.
The expansionary phase in world exports of Food processing Machinery continued in Q2-2026 as well...
In cumulative terms (first six months of the year), world exports of Food processing Machinery showed year-on-year growth of more than 8 percentage points in the constant price measurement - a slight acceleration compared to the already positive 2025 result (+7.6% at constant prices) - and confirming themselves as much more dynamic than the industrial machinery sector as a whole (+3.1% at constant prices).
..but with sharp differences across international markets.
Leading Markets in Q2 2026
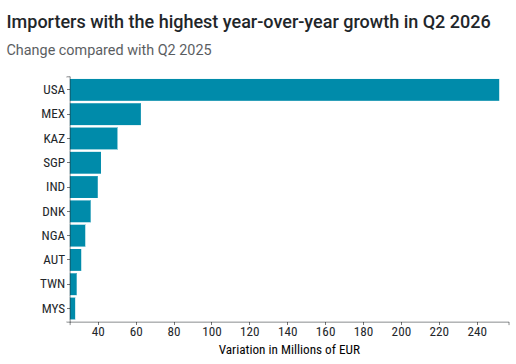
In the second quarter of the year, the largest year-on-year increases in world exports of food processing machinery, in euro values, were recorded — above all — toward the United States (+252 million euros compared with the same period of 2025, equal to +24.4%), followed by the markets of Mexico (+62.6 million euros, thanks to strong percentage growth of +27.9%), Kazakhstan (+50.3 million euros), Singapore (+41.6 million euros, equal to +49.1%) and India (+39.9 million euros).
Fonte: ExportPlanning
Other world markets showing year-on-year growth in Q2-2026 were, in order, Denmark (+36.1 million euros compared with Q2-2025, equal to +71.6%), Nigeria (+33.3 million euros, thanks to a percentage increase of more than 103 points), Austria (+31.1 million euros, thanks to a percentage increase of more than 23 points), Taiwan (+28.7 million euros) and Malaysia (+27.9 million euros, thanks to a percentage increase close to 42 points).
Lagging Markets in Q2 2026
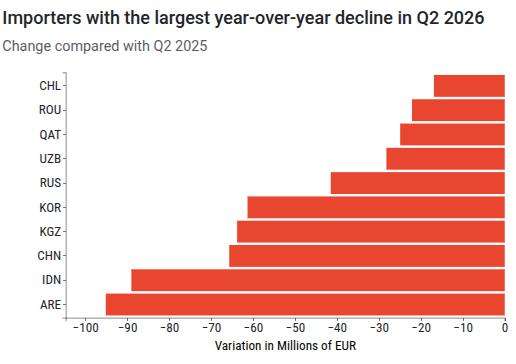
In the second quarter of the year, by contrast, the largest year-on-year declines in world exports of Food Machinery, in euro values, were recorded — above all — toward the markets of the United Arab Emirates (-95.1 million euros compared with the same period of 2025, a decline of -65.7%) and Indonesia (-89 million euros, due to a percentage decline of more than 32 points), followed by the markets of China (-65.7 million euros, equal to -20%), Kyrgyzstan (-63.8 million euros, corresponding to a decline of 80 points) and South Korea (-61.3 million euros, corresponding to a decline of almost 36 points).
Fonte: ExportPlanning
Other world markets showing a year-on-year decline in Q2-2026 were, in order, Russia (-41.5 million euros compared with Q2-2025, equal to -16%), Uzbekistan (-28.2 million euros, caused by a year-on-year decline of 54 points), Qatar (-24.9 million euros, due to a percentage decline of more than 90 points), Romania (-22.1 million euros, corresponding to a percentage decline of 33 points) and Chile (-16.9 million euros, equal to -31.2%).
Conclusions
The most recent data (Q2-2026) on world trade, available on ExportPlanning, confirm an overall favorable business-cycle picture for world sales of Food processing Machinery, with year-on-year growth for the 14th consecutive quarter in the constant-price measure — decidedly more favorable than that of the industrial machinery sector as a whole.
However, this picture is quite heterogeneous across destination markets, with — on one hand — "booming" importing countries driving world sales of the sector and, on the other, "slowing" importing countries.
To check the leading and lagging markets for a given sector (or product), try the ExportPlanning Dashboard
For Food processing Machinery exporters, it is therefore essential to be able to promptly identify the markets showing the strongest year-on-year growth, which represent the priorities for short-term commercial focus.
Thanks to the new interactive content available in the Dashboard tool, the ExportPlanning platform makes it possible, in just a few clicks, to answer, among others, the key question raised in this article:
- which are the most dynamic ("leading") markets in the most recent period ?
- which are the least dynamic ("lagging") markets in the most recent period ?
1) See the list of products included in the descriptive sheet for this sector.
2) In the World Trade Datamart of the ExportPlanning Information System, the measure Quantities at constant prices (Q) has been constructed. This measure incorporates a deflation process, whereby the historical series of monetary values (V) has been transformed into a corresponding series expressed at constant prices, with reference to a specific year, known as the base year. For a description of the methodology applied, see the Methodological Note of the World Trade Datamart.
You may be interested in:

Machinery: International Sales Results to July 2026
Published by Marcello Antonioni. .
Industrial equipment Conjuncture Monthly Market Data Global economic trendsIn July Machinery exports by EU companies remained in positive territory, but with significant differences across sectors [ Read all ]

World Trade: Increasingly Polarized Growth – July 2026 Update
Published by Marzia Moccia. .
Conjuncture Foreign markets Uncertainty Global economic trendsWorld trade continues to grow in 2026, but behind the resilience of the aggregate figures, disparities across sectors and geographic regions are widening [ Read all ]

Leather Machinery: After the 2026 Downturn, the Outlook for World Trade in 2027-2028
Published by Mauro Badanelli. .
Industrial equipment Forecast International marketing2026 is shaping up to be a year of contraction in world trade of machinery for the manufacture or repair of leather or hide articles (HS845380), following the levels reached in 2025. According to Expo}... [ Read all ]