Footwear: how are the manufacturing Countries performing in the first half of 2026?
Published by Mauro Badanelli. .
Conjuncture Industries Foreign markets International marketingAfter analyzing the dynamics of global trade in footwear machinery in a previous article, attention now shifts to the finished product, in order to examine the most recent performance of the main footwear-producing countries1.
The sector represents an interesting indicator of the transformations affecting manufacturing value chains. Sourcing methods, production specializations and relationships between the different links in the value chain are changing, in a context characterized by an increasingly diversified geography of production and trade.
In particular, to analyze the state of health of the main footwear industry players in the first half of 2026, we used export performance as a proxy. In the absence of updated and internationally comparable production data, trade flows can in fact provide an initial indication of the short-term dynamics of the main players.
Global footwear trade appears to be growing
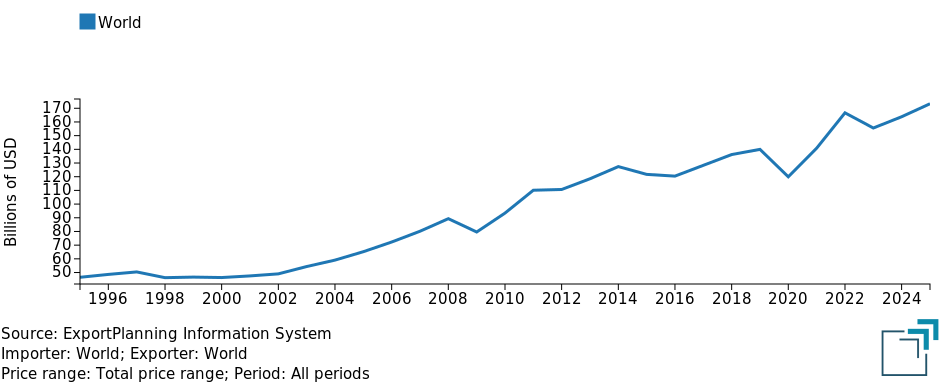
By analyzing the trend in international footwear trade, a steady long-term growth can be observed, quantified by a compound annual growth rate (CAGR) of +3.0% in current euros over the 2009-2025 period. A shorter-term comparison (2019-2025) shows a slowdown in the growth of international trade, with average annual growth standing at 2.4%.
At constant prices, the compound annual growth rate for the 2009-2025 period is slightly positive at +0.6%, while between 2019 and 2025 the figure is negative: -4.1%.
Fig. 1 – Footwear: Global trade (2025 data)
Source: ExportPlanning elaborations
The main sector players in 2025
Among the main footwear producers, the clear predominance of Asian Countries stands out, alongside several European production hubs.
Tab. 1 - Footwear: Main producing Countries worldwide (2025 data)
| Production | Trade Balance | |||
| # | Country | € Mln | € Mln | Norm. (-1/+1) |
| 1 | China | 48 386 | + 34 312 | +0.78 |
|---|---|---|---|---|
| 2 | Vietnam | 33 213 | + 26 643 | +0.88 |
| 3 | Germany | 18 633 | - 3 258 | -0.13 |
| 4 | Italy | 16 531 | + 4 170 | +0.22 |
| 5 | Netherlands | 11 471 | - 3 | 0.00 |
| 6 | Belgium | 11 101 | + 3 016 | +0.24 |
| 7 | France | 9 043 | - 3 113 | -0.23 |
| 8 | Indonesia | 8 727 | + 6 064 | +0.75 |
| 9 | Poland | 7 337 | - 864 | -0.09 |
| 10 | Spain | 6 042 | - 1 722 | -0.19 |
| 11 | India | 3 104 | + 1 780 | +0.65 |
| 12 | Cambodia | 2 847 | + 1 732 | +0.74 |
| 13 | Hong Kong | 2 685 | - 12 | 0.00 |
| 14 | Portugal | 2 394 | + 736 | +0.26 |
| 15 | USA | 2 349 | - 22 840 | -0.91 |
Source: ExportPlanning - Data Hub - Annual Trade Data, Datamart Ulisse
China confirms its position as the absolute leader, with production reaching €48.4 billion in 2025. China is also the leader in terms of the trade balance for this product, recording a value of +€34.3 billion in 2025, corresponding to a normalized trade balance (NTB)2 of +0.78, signaling a strong specialization in the sector.
The degree of specialization is even higher in the world's second-largest footwear producer, Vietnam, with an NTB of 0.88. Other significant Asian producers include Indonesia (€8.7 billion), India (€3.1 billion) and Cambodia (€2.8 billion). All these countries report positive trade balances, confirming their role as net exporters.
Among the leading European footwear-producing Countries, some can be identified as producers and exporters, while others primarily act as logistics hubs. The former include Germany, which, despite having a high production value (€18.6 billion), records a negative trade balance (-€3.2 billion), suggesting that it also plays an important role as a global importer of footwear. Italy is also among the world's leading producers, but, unlike Germany, has a clearly positive trade balance (€4.2 billion), reflecting its strength as a footwear exporter.
Both the Netherlands and Belgium can be classified as logistics hubs, as they have an NTB of zero or only slightly above zero and play the role of importers followed by re-exporters.
Are you interested in receiving a selection of the week's most relevant foreign trade news? Subscribe to the World Business Newsletter for free!
How are the main footwear-producing Countries performing in H1 2026?
As indicated at the beginning of this article, analyzing trade flows in the first half of 2026 provides an initial indication of the state of health of production activity in the main Countries in the footwear sector. In the absence of updated and internationally comparable production data, export performance therefore represents a useful proxy for assessing the short-term dynamics of the main players. This is possible thanks to the preliminary estimates for Q2 available in the ExportPlanning information system.
The export picture for H1 2026 is characterized by strong contrasts between Asian and European producers. The two largest global players both show a decline in foreign sales. China, with exports worth €18.3 billion, remains the global leader but records a -13.4% contraction compared with H1 2025. Vietnam (the second-largest producer in 2025) exported €13.3 billion worth of footwear, recording a more limited decline of -4.2% compared with H1 2025. India also recorded a significant decline in exports in the first part of the year (-10.5%), while Cambodia posted growth of +9.7% compared with the same period in 2025.
Tab. 2 - Footwear: H1-2026 exports of the main producing Countries in 2025
(current values)
| Rank | Country | H1-2026 Exports € Mln |
Year-on-year change H1-2026/25 |
|---|---|---|---|
| 1 | China | 18 277 | -13.4% |
| 2 | Vietnam | 13 256 | -4.2% |
| 3 | Germany | 5 718 | +0.8% |
| 4 | Italy | 5 819 | -1.7% |
| 5 | Netherlands | 3 538 | +6.2% |
| 6 | Indonesia | 3 490 | +1.2% |
| 7 | France | 2 593 | -0.2% |
| 8 | Poland | 2 093 | +5.4% |
| 9 | Spain | 1 774 | -4.2% |
| 10 | Cambodia | 1 623 | +9.7% |
| 11 | Belgium | 1 101 | -73.0% |
| 12 | India | 1 036 | -10.5% |
| 13 | Portugal | 858 | -0.4% |
| 14 | Hong Kong | 708 | -23.2% |
| 15 | USA | 517 | -14.5% |
Source: ExportPlanning elaborations
Among the main European producers, the situation appears more stable. Italy (the fourth-largest producer in 2025) confirms its resilience, with exports of €5.8 billion, limiting the decline to -1.7%. Germany (the third-largest producer) shows a slightly positive change of +0.8%, with exports amounting to €5.7 billion. For these two Countries, which have the highest share of the premium price segment among the different European countries listed in Table 2, the positive performance is driven by stronger demand for high-end and upper-mid-range products.
Conclusions
The analysis of H1 2026 trade flows, used as a proxy for production activity, provides a nuanced picture of the footwear sector. Export performance highlights significantly different dynamics among the main producing Countries: the contraction recorded by some major Asian players contrasts with the greater resilience of European producers and the growth of some emerging Countries.
Against this backdrop, Italy demonstrates a particularly strong capacity to withstand the downturn. The limited decline in exports in H1 2026, compared with the dynamics observed in other major producing Countries, confirms the strength of its international positioning.
Although trade flows do not represent a direct measure of production, monitoring them therefore makes it possible to obtain timely indications of short-term developments and competitive balances among different Countries. Export analysis thus becomes a useful lens through which to interpret the ongoing transformations in the global production geography of the footwear industry.
1) See the list of sectors included in the descriptive sheet for this industry.
2) The “simple” trade balance (Exports-Imports) is heavily influenced by market size. The normalized version, on the other hand, allows for more meaningful comparisons: across different Countries; across sectors of different sizes; and over time. The normalized trade balance (measured using the formula [Exports-Imports]/[Exports+Imports] and hereafter referred to by the acronym "NTB") is an indicator widely used in international competitiveness studies and trade specialization analyses.
The NTB indicator can take values between -1 and +1:
- +1 → exports only, no imports (maximum surplus);
- 0 → exports equal to imports;
- -1 → imports only, no exports (maximum deficit).
- positive NTB values (and increasing values over time) indicate strong Country specialization in a given sector or product;
- negative NTB values (and decreasing values over time) indicate dependence on imports and a lack of specialization;
- NTB values close to zero indicate a balanced situation.
You may be interested in:

Export 2026-2029: ExportPlanning updates its forecast scenario
Published by Marzia Moccia. .
Conjuncture Export markets Uncertainty IMF Global economic trendsFor exporting companies, the ability to promptly interpret the evolution of international markets is now a key competitive factor. In a global context characterized by rapid changes and growing unce}... [ Read all ]
Footwear Machinery: the map of Growing and Slowing markets in Q2 2026
Published by Mauro Badanelli. .
Industrial equipment Conjuncture Foreign markets International marketingFor exporting companies, the international context is changing increasingly rapidly. Relying on consolidated year-end data often means arriving too late. Having indicators updated to the second quarte}... [ Read all ]
Global trade in footwear machinery: China dominates, Italy leads the way in premium technology
Published by Mauro Badanelli. .
Industrial equipment Conjuncture Foreign markets International marketingThe footwear machinery industry represents one of the pillars of manufacturing innovation in the fashion sector. In an increasingly competitive environment, characterized by global markets, growing }... [ Read all ]