Leather Machinery: After the 2026 Downturn, the Outlook for World Trade in 2027-2028
Published by Mauro Badanelli. .
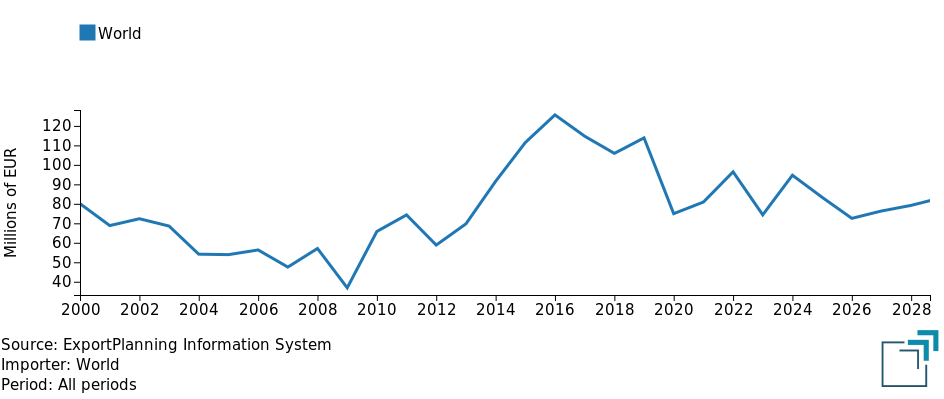
Industrial equipment Forecast International marketing2026 is shaping up to be a year of contraction in world trade of machinery for the manufacture or repair of leather or hide articles (HS845380), following the levels reached in 2025. According to ExportPlanning estimates, the value of international trade will decline from €83.3 million in 2025 to €72.6 million in 2026, recording a -12.9% contraction in current values.
The decline nevertheless appears to be mainly cyclical. The forecast scenario points to a recovery starting as early as 2027, with international trade increasing by +5.2% in current values compared with the previous year, followed by a further +3.8% in 2028. World trade is therefore expected to reach €79.2 million in 2028, recovering part of the value lost in 2026.
Fig.1 – Leather goods machinery – World trade 2000-2028
(million euros)
2026 affected by the slowdown in the main Asian markets
The weakness in world trade in 2026 is strongly influenced by the performance of the main destination markets. International demand for Leather goods machinery is in fact highly geographically concentrated, with the largest importers located mainly in Asia.
Indonesia, the leading market for machinery for leather goods imports, will see imports decline from around €41 million in 2025 to €31 million in 2026, a decrease of -24.4%. Despite the decline, the country remains by far the leading international market, accounting for more than 40% of global imports.
A similar trend is affecting India, the second-largest destination market, where imports are expected to reach €12 million in 2026, compared with €15 million the previous year (-20%). Vietnam is also recording a slight contraction.
The simultaneous decline in demand in these three major markets therefore contributes significantly to the overall contraction expected in international trade in the sector in 2026.
Not all Asian markets, however, are following the same trajectory. Cambodia is moving in the opposite direction, with imports increasing from €3 million to around €4 million. Even more marked, although starting from relatively low levels, is the growth in South Korea, where demand rises from around €1 million to €2.6 million (+7.8%).
Outside the main markets, positive signals are also emerging from Ethiopia, Peru, Bangladesh, Egypt and Uzbekistan, all of which are recording an increase in leather goods machinery imports during 2026.
Overall, the analysis of the current situation therefore paints a mixed picture: the global contraction is concentrated mainly in the largest markets, while several smaller destinations are already showing signs of expansion.
Are you interested in receiving a selection of the most relevant news of the week on international trade? Subscribe to the World Business Newsletter for free!
Global demand will resume growth from 2027
The forecast scenario developed by ExportPlanning points to a change in direction over the following two years. After reaching a low in 2026, world trade in leather goods machinery is expected to grow by +5.2% in 2027 and +3.8% in 2028.
The recovery will be positive, but slightly less intense than that expected for the broader aggregate of “machinery and equipment for industrial processes”. The macro-sector is expected to grow at an average annual rate (CAGR) of +5.7% between 2026 and 2028, compared with +4.5% forecast for leather goods machinery .
Table 1 - Leather goods machinery - Dynamics of the main importing countries
(current values)
| Position | Country | 2025 Mln € |
2026E Mln € |
2028E Mln € |
Trend Var. 2026-25 |
CAGR 2026-28 |
|---|---|---|---|---|---|---|
| 1 | Indonesia | 41.4 | 31.2 | 35.6 | + 7.7% | + 6.8% |
| 2 | India | 15.3 | 12.4 | 14.1 | + 7.4% | + 6.6% |
| 3 | Cambodia | 3.2 | 3.7 | 4.2 | + 7.7% | + 6.9% |
| 4 | Vietnam | 4.7 | 4.3 | 4.2 | - 0.4% | - 1.1% |
| 5 | South Korea | 0.7 | 2.6 | 3.0 | + 7.8% | + 6.9% |
| 6 | France | 2.3 | 2.3 | 2.6 | + 7.2% | + 6.4% |
| 7 | Ethiopia | 0.0 | 2.0 | 2.3 | + 9.1% | + 8.1% |
| 8 | Bangladesh | 1.0 | 1.9 | 2.1 | + 6.7% | + 5.9% |
| 9 | Peru | 0.3 | 1.8 | 2.0 | + 7.4% | + 6.8% |
| 10 | Egypt | 0.9 | 1.7 | 1.9 | + 6.6% | + 6.2% |
| 11 | United States | 1.8 | 1.8 | 1.9 | + 4.1% | + 3.2% |
| 12 | Thailand | 1.4 | 1.7 | 1.6 | - 2.2% | - 2.9% |
| 13 | Slovak Republic | 0.0 | 1.2 | 1.4 | + 8.1% | + 7.2% |
| 14 | South Africa | 0.3 | 1.3 | 1.4 | + 3.6% | + 2.8% |
| 15 | Spain | 1.5 | 1.3 | 1.3 | + 0.6% | - 0.2% |
| 16 | Kenya | 0.2 | 1.0 | 1.2 | + 8.2% | + 7.3% |
| 17 | Turkey | 1.4 | 1.1 | 1.1 | + 0.7% | + 0.6% |
| 18 | Uzbekistan | 0.8 | 0.9 | 1.1 | + 13.5% | + 12.5% |
| 19 | Serbia | 0.4 | 0.9 | 1.1 | + 8.4% | + 7.3% |
| 20 | Philippines | 0.2 | 0.7 | 0.8 | + 7.7% | + 6.8% |
Source: ExportPlanning elaborations
The recovery will continue to be driven mainly by the major Asian manufacturing hubs
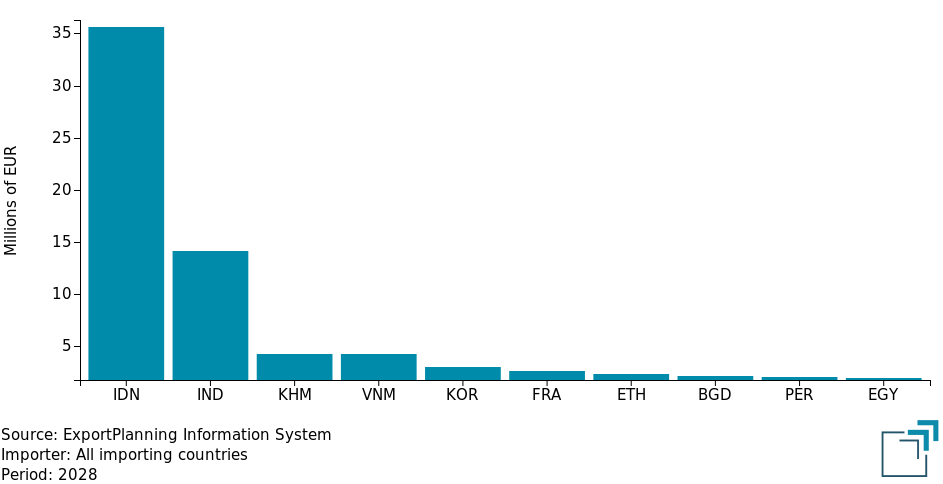
Indonesia will further consolidate its leading position, with imports expected to reach around €34 million in 2027 and €36 million in 2028. By the end of the forecast horizon, the country could account for almost 45% of the global market.
India is also expected to return to a growth path, reaching around €13 million in 2027 and €14 million in 2028, with a share of world trade of approximately 18%.
The outlook for Vietnam, on the other hand, appears more stable, while Cambodia could consolidate the position it has acquired in recent years.
Overall, Indonesia, India, Vietnam and Cambodia will therefore continue to constitute the main international demand hub for machinery used in leather processing, collectively accounting for more than 73% of global imports.
Fig.2 - Leather goods machinery - The main importing countries in 2028
(forecasts)
Not only Asia: the fastest-growing markets
Alongside the main markets, the 2027-2028 scenario highlights a group of economies characterized by particularly strong import growth rates for leather goods machinery. These are markets whose size remains relatively limited in absolute terms, but which may be of interest as part of a geographical export diversification strategy.
Among these, Uzbekistan stands out, with the highest expected growth rate: imports are forecast to increase at an average annual rate (CAGR) of +12.5% between 2026 and 2028.
Positive signals are also coming from East Africa. Ethiopia is expected to record average annual growth of 8.1%, while Kenya has prospects of more than 7%.
Other markets with positive prospects include Serbia, Slovak Republic and Peru, all characterized by average annual growth rates close to or above 7%.
Some more mature markets also offer positive indications. South Korea is expected to continue the growth path that began in 2026, while in Europe France stands out among the destinations with the most dynamic prospects, with a forecast CAGR of +6.4% over the 2026-2028 period.
Conclusions
The forecast scenario therefore points to a relatively small and highly concentrated global market, with international demand expected to return to a growth path over the 2027-2028 period.
The 2026 contraction appears to be strongly driven by the slowdown in the major Asian markets and, in particular, Indonesia. The high degree of geographical concentration makes world trade in leather goods machinery particularly sensitive to fluctuations in demand in the main manufacturing hubs.
At the same time, the recovery expected from 2027 onwards and the growth of smaller markets open up prospects for greater geographical diversification.
For exporting companies, the scenario therefore suggests complementing their presence in the major Asian markets with increasing attention to destinations characterized by above-average development prospects, particularly in Central Asia, East Africa and some European economies.
The ability to identify these trajectories at an early stage may become an important element in defining commercial strategies for the 2027-2028 period.

You may be interested in:

Hollow glass machinery: global trade set to accelerate in 2026
Published by Mauro Badanelli. .
Industrial equipment Conjuncture Foreign markets Global economic trendsThe global trade in machinery for the production and processing of hollow glass1 has shown a marked reversal in the first seven months of 2026, compared with the weakness that characterised the 2022–2}... [ Read all ]

Machinery: International Sales Results to July 2026
Published by Marcello Antonioni. .
Industrial equipment Conjuncture Monthly Market Data Global economic trendsIn July Machinery exports by EU companies remained in positive territory, but with significant differences across sectors [ Read all ]

Leather goods machinery: Italian leadership in the world trade
Published by Mauro Badanelli. .
Industrial equipment Conjuncture Foreign markets International marketingThe international trade fair for machinery and technologies for footwear, leather goods and tanning, Simac Tanning Tech, will take place from September 15 to 17 at the Rho Fiera exhibition centre, b}... [ Read all ]