FDI: Growth Fails to Keep Pace with the Global Economy
Global Foreign Direct Investment Returns to Growth, but the Recovery Remains Fragile and Uneven
Published by Marzia Moccia. .
Internationalisation Total goods Global demand Global economic trendsThe update of the foreign direct investment (FDI) database, incorporating the 2025 data published by UNCTAD and available in the dedicated section of ExportPlanning, provides an opportunity to analyse the evolution of international investment flows and identify the main trends shaping the global economic landscape.
GDP, world trade and FDI: diverging growth trends
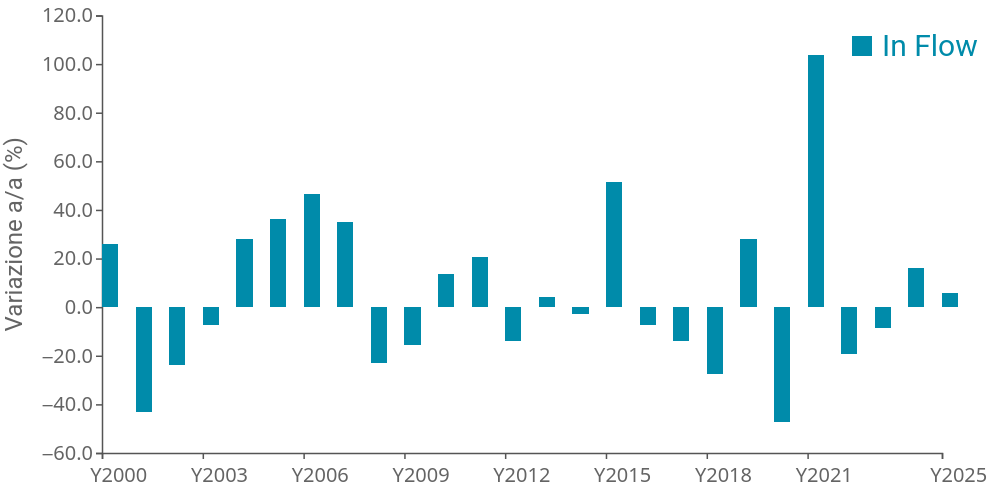
In 2025, global foreign direct investment (FDI) inflows increased by 6%, reaching $1.62 trillion, compared with $1.53 trillion in 2024.
This marked the second consecutive year of growth, following the 15.9% increase recorded in 2024, confirming a recovery in international investment, albeit at a slower pace. The positive trend points to a degree of resilience in cross-border capital flows, despite an environment characterised by geopolitical tensions, trade policy uncertainty and high financing costs.
Fig.1 – Annual changes in global FDI inflows
(data in current US dollars)
Source: ExportPlanning calculations based on UNCTAD data
According to UNCTAD, however, growth remains fragile and highly concentrated in a limited number of economies and strategic sectors, particularly those characterised by high technological and capital intensity.
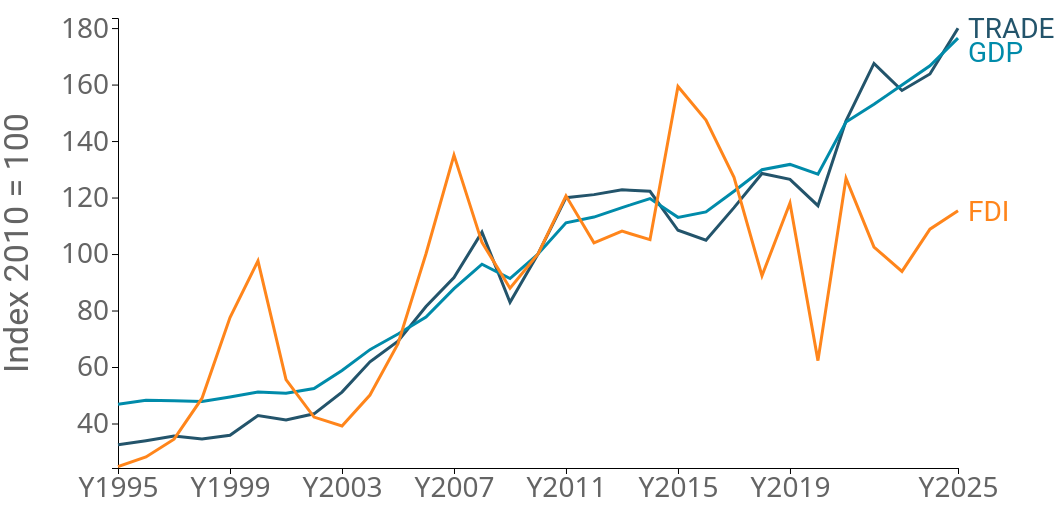
The recovery therefore takes place against a backdrop of persistent structural weakness in international investment, as illustrated by the comparison of global GDP, international trade and FDI trends over the 2010–2025 period.
Fig.2 – Comparison of GDP, world trade and FDI (2010=100 index)
(data in current US dollars)
Source: ExportPlanning calculations based on UNCTAD and IMF data
Over the period under review, world trade and global GDP followed broadly aligned growth trajectories, recording cumulative increases of 80% and 76%, respectively, measured in current US dollars. This trend reflects the close relationship between the expansion of global economic activity and international trade.
Foreign direct investment, by contrast, followed a markedly different trajectory: after peaking in 2015, FDI flows displayed considerable volatility and much weaker overall growth, standing just 15% above their 2010 level in 2025.
This divergence appears to reflect a transformation in companies' internationalisation strategies and in the ways the global economy is integrated. Following a prolonged period of expansion in production offshoring and global value chains, international trade has been able to continue growing partly through the consolidation and more intensive use of existing production and commercial networks, without requiring a proportional increase in new cross-border investment.
This trend has been accompanied, particularly since the pandemic, by greater selectivity among multinational companies in their investment location decisions. Alongside the traditional pursuit of cost advantages, supply chain security, proximity to end markets and the need to limit exposure to geopolitical risks have become increasingly important considerations.
Geography of investment: diverging regional trends
The transformation of companies' internationalisation strategies is also reflected in a profound reshaping of the geography of foreign direct investment. A comparison between 2015 and 2025 reveals significant changes in the distribution of global flows, with Asian and emerging economies gaining importance while Europe's relative weight declines.
Table 1 – Geographical redistribution of FDI inflows: regional shares in 2015 vs 2025
(% share of total)
| AREA | 2015 | 2025 |
|---|---|---|
| Asia | 22.2 | 34.6 |
| North America | 24.7 | 24.0 |
| EU Europe | 36.3 | 10.3 |
| MENA | 1.8 | 9.2 |
| Latin America | 5.5 | 8.6 |
| Non EU Europe | 6.3 | 8.2 |
| Sub-Saharan Africa | 1.7 | 2.9 |
| Oceania and South Africa | 1.4 | 2.1 |
Asia remains the leading destination for international investment, with its share of global inflows rising from 22.2% in 2015 to 34.6% in 2025, a gain of more than 12 percentage points. This development is consistent with the region's growing importance, driven not so much by China as by economies such as Singapore and India and, more broadly, the ASEAN countries.
North America, meanwhile, maintains a broadly stable position, with its share standing at around 24%. This overall stability nevertheless conceals differing trends among the region's main economies: the relative weight of the United States has declined, while the shares of Canada and Mexico have increased.
The most significant change concerns the European Union, whose share of global FDI inflows fell from 36.3% in 2015 to 10.3% in 2025, a decline of 26 percentage points.
The European figures nevertheless require particular caution in their interpretation. FDI flows, especially in advanced economies, can be significantly affected by major mergers and acquisitions, corporate restructuring and capital movements through international financial centres. The sharpest declines in relative share concern Ireland and the Netherlands, economies particularly exposed to these dynamics. However, Europe's decline has not been uniform: over the decade under review, Germany and Spain recorded increases in their respective shares of global FDI inflows.
Other emerging regions are also gaining importance. Particularly noteworthy is the increase in the share of MENA countries, which rose from 1.8% to 9.2% of global inflows.
Latin America also recorded an increase in its share, from 5.5% to 8.6%, driven primarily by Brazil.
Overall, the comparison highlights a geographical redistribution of international investment flows across a broader range of destinations, with Asia occupying a dominant position and several emerging economies gaining importance. This development is consistent with changing corporate location strategies, as companies increasingly consider not only cost differentials but also market growth prospects and the availability of infrastructure and skills.
You may be interested in:

Exports 2027–2030: ExportPlanning Forecast Scenario Updated
Published by Marzia Moccia. .
Total goods Forecast Export markets Foreign markets Uncertainty Foreign market analysisWhich markets are experiencing accelerating international demand? Which markets and sectors offer the most significant opportunities? For exporting companies, identifying these changes}... [ Read all ]

World Trade September 2026: Growth at Different Speeds
Published by Marzia Moccia. .
Conjuncture Global demand Foreign markets Uncertainty Global economic trendsIl commercio internazionale conferma una crescita sostenuta anche nel terzo trimestre, ma permangono le divergenze settoriali [ Read all ]

Woodworking machinery: Italian exports grow
Published by Mauro Badanelli. .
Internationalisation Industrial equipment Foreign markets Monthly Market Data International marketingNei primi sette mesi del 2026 le esportazioni italiane mostrano un incremento sul 2025, mentre le vendite all'estero dei principali concorrenti calano [ Read all ]